342 Global Equity Funds, AUM $1.1bn
Global Active Fund Performance & Attribution Review, 2023
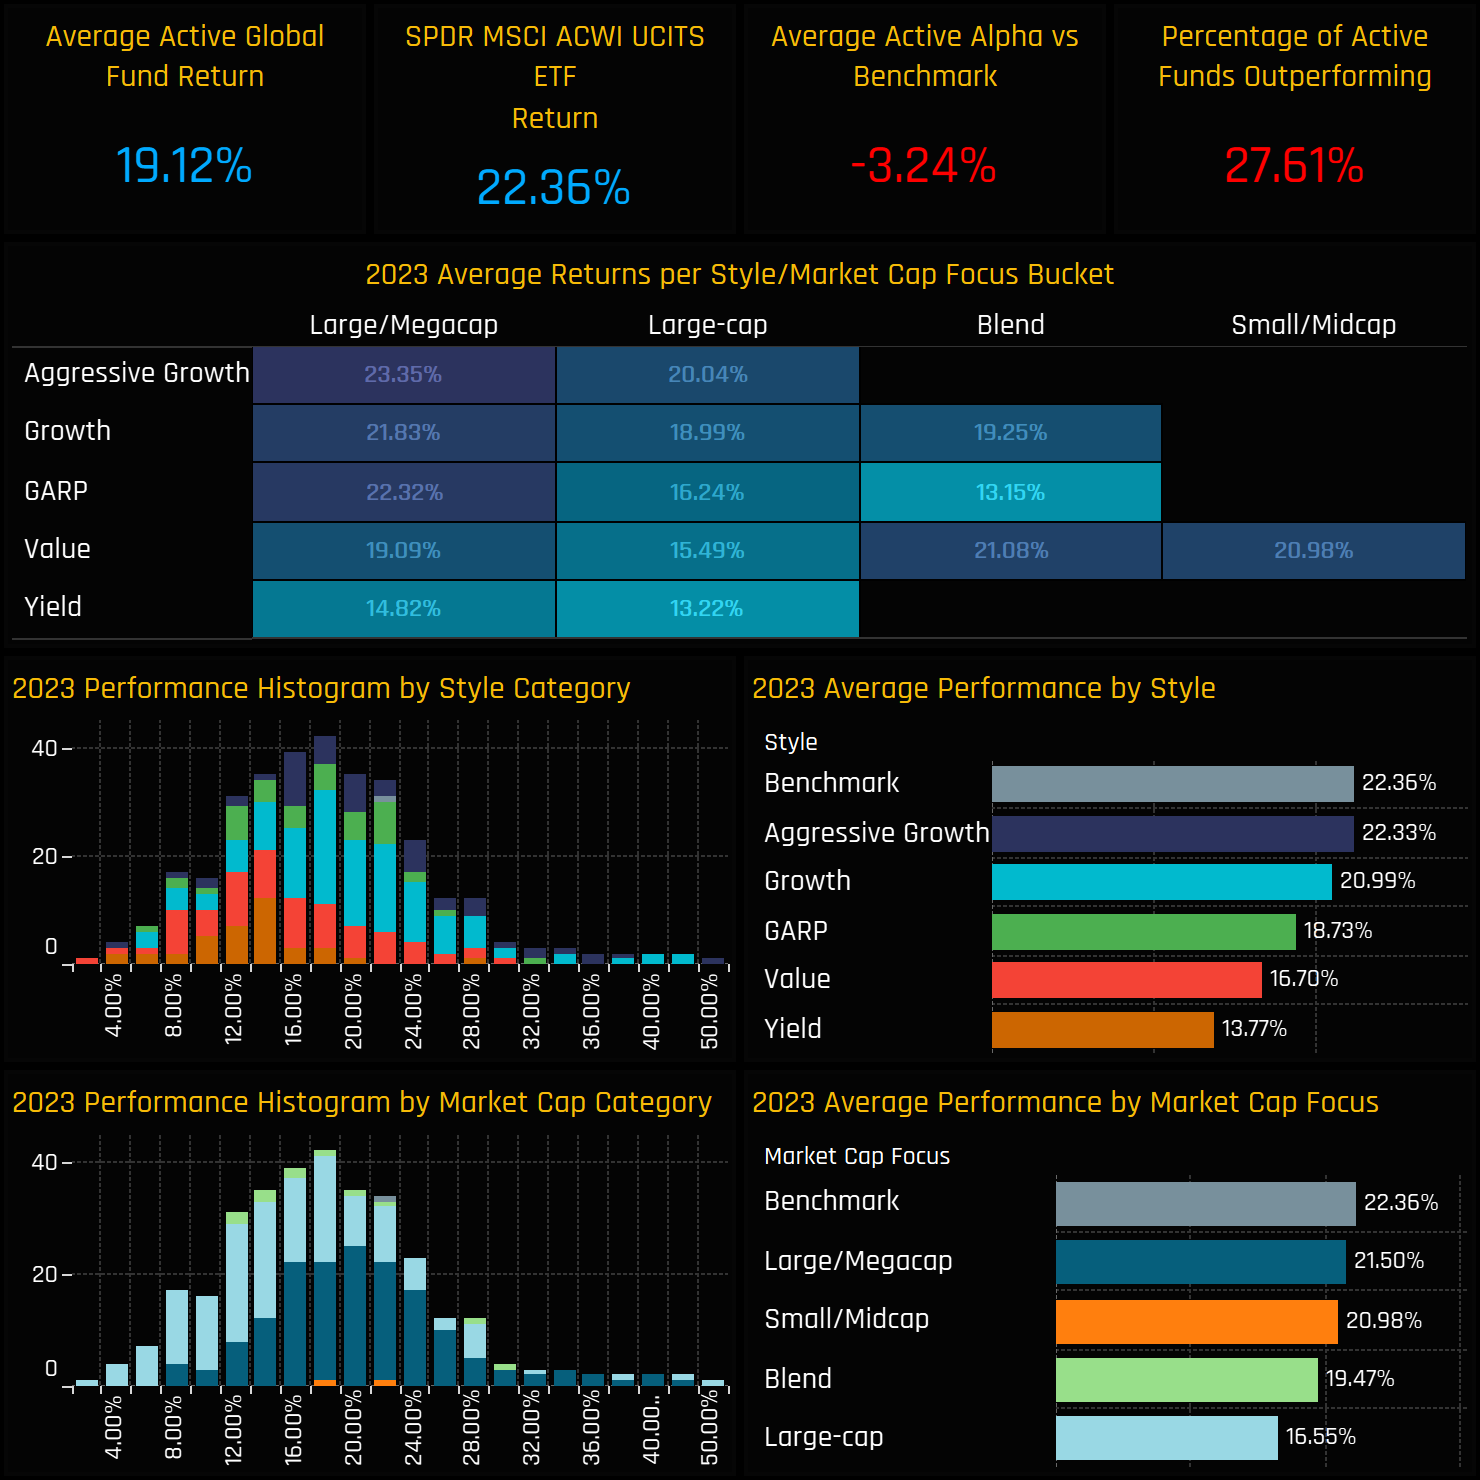
Active Global funds posted strong returns of 19.1% in 2023, but few surpassed the benchmark MSCI ACWI benchmark.
Value and Yield funds severely dragged on fund returns, underperforming the top Growth funds by a significant margin.
Returns driven by the Magnificent 7 group of stocks, but underperformance driven by a large US underweight and poor stock selection.
2023 Fund Performance
Active Global funds faced a mixed year in 2023. Despite a strong average return of 19.12%, this fell short of the SPDRs MSCI ACWI ETF return by -3.24%, with only 27.6% surpassing the benchmark. Style appears to have been a key factor, with Aggressive Growth funds returning 8.5% more than their Yield counterparts, but curiously no Style group outperformed the benchmark.
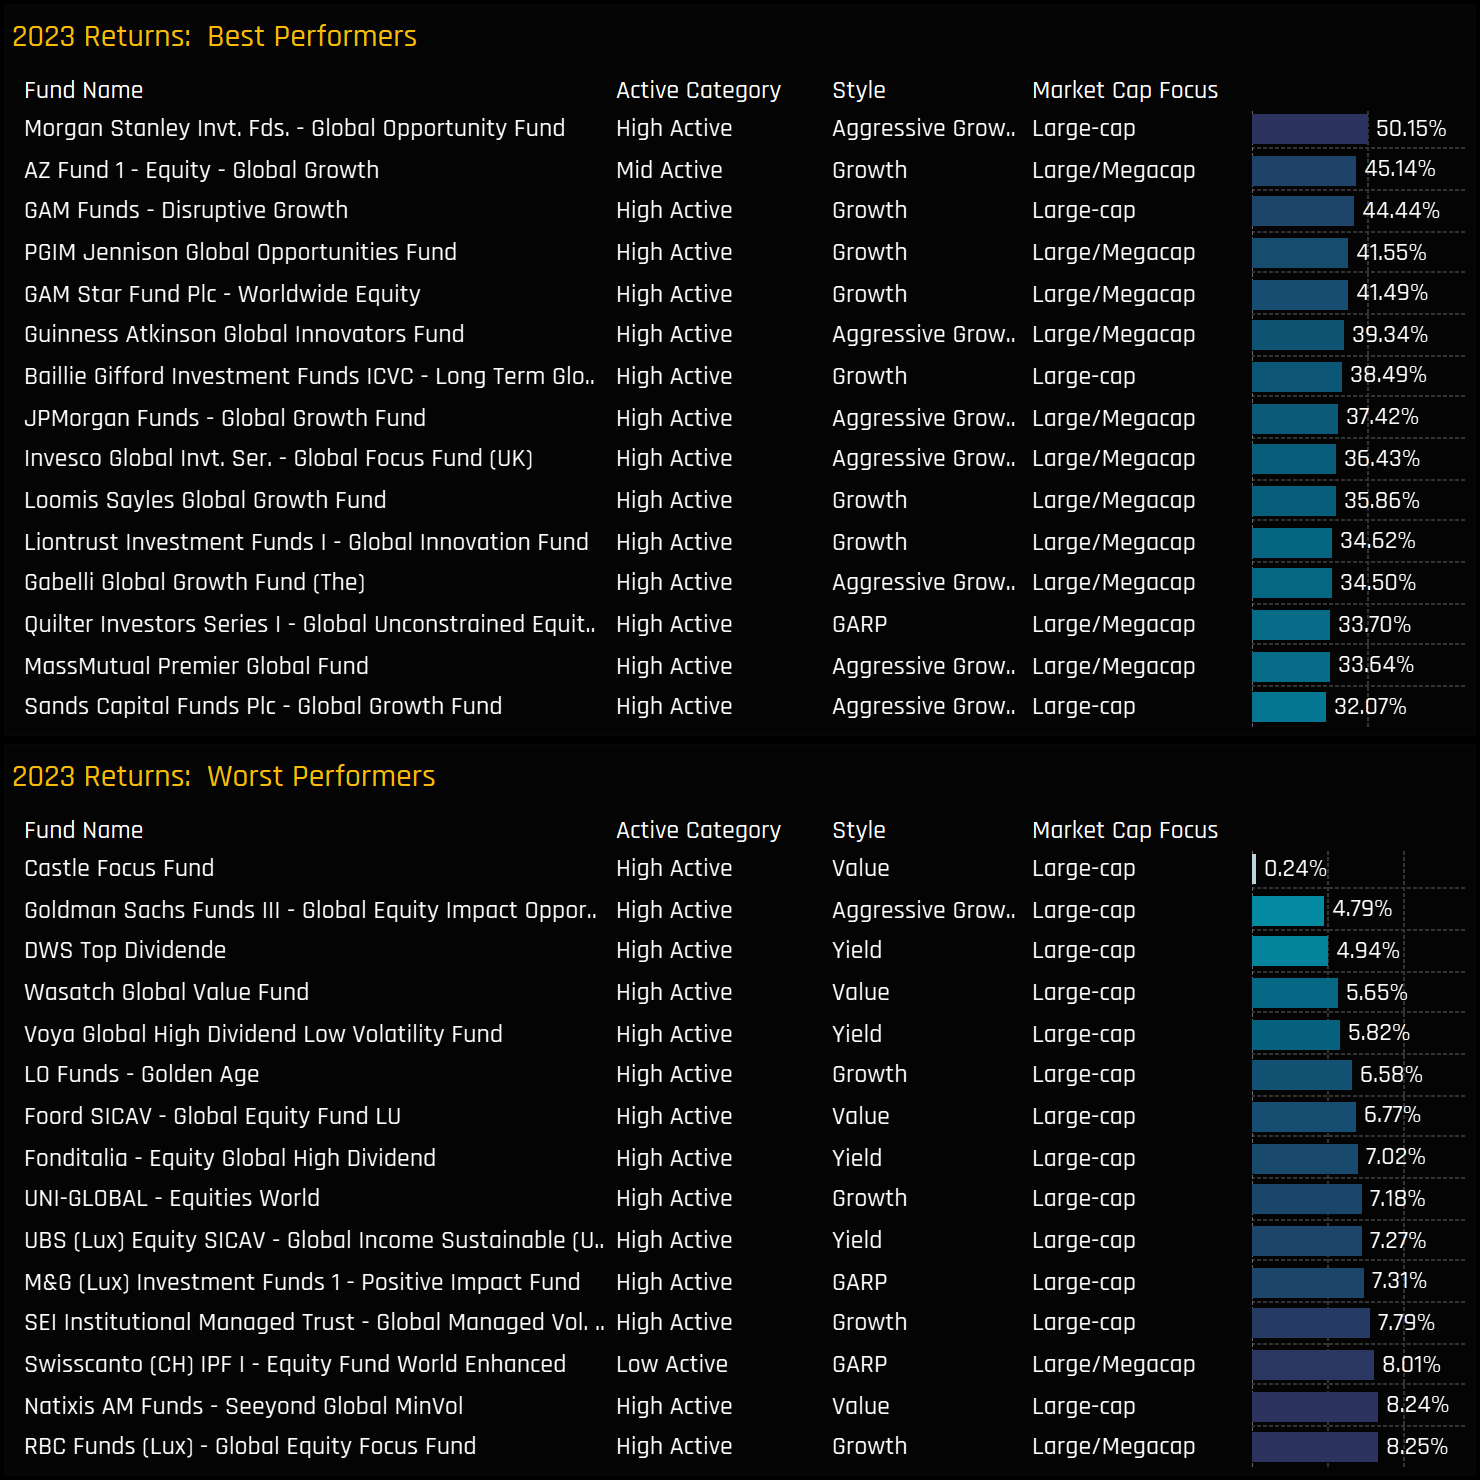
The range of returns among individual funds was substantial in 2023. Morgan Stanley Global Opportunities topped the list with a remarkable 50.15%, leading five funds that achieved annual returns exceeding 40%. Growth and Aggressive Growth funds dominate the list of top performers, while Value and Yield funds were prevalent among the bottom performers.
Morgan Stanley Global Opportunity Fund
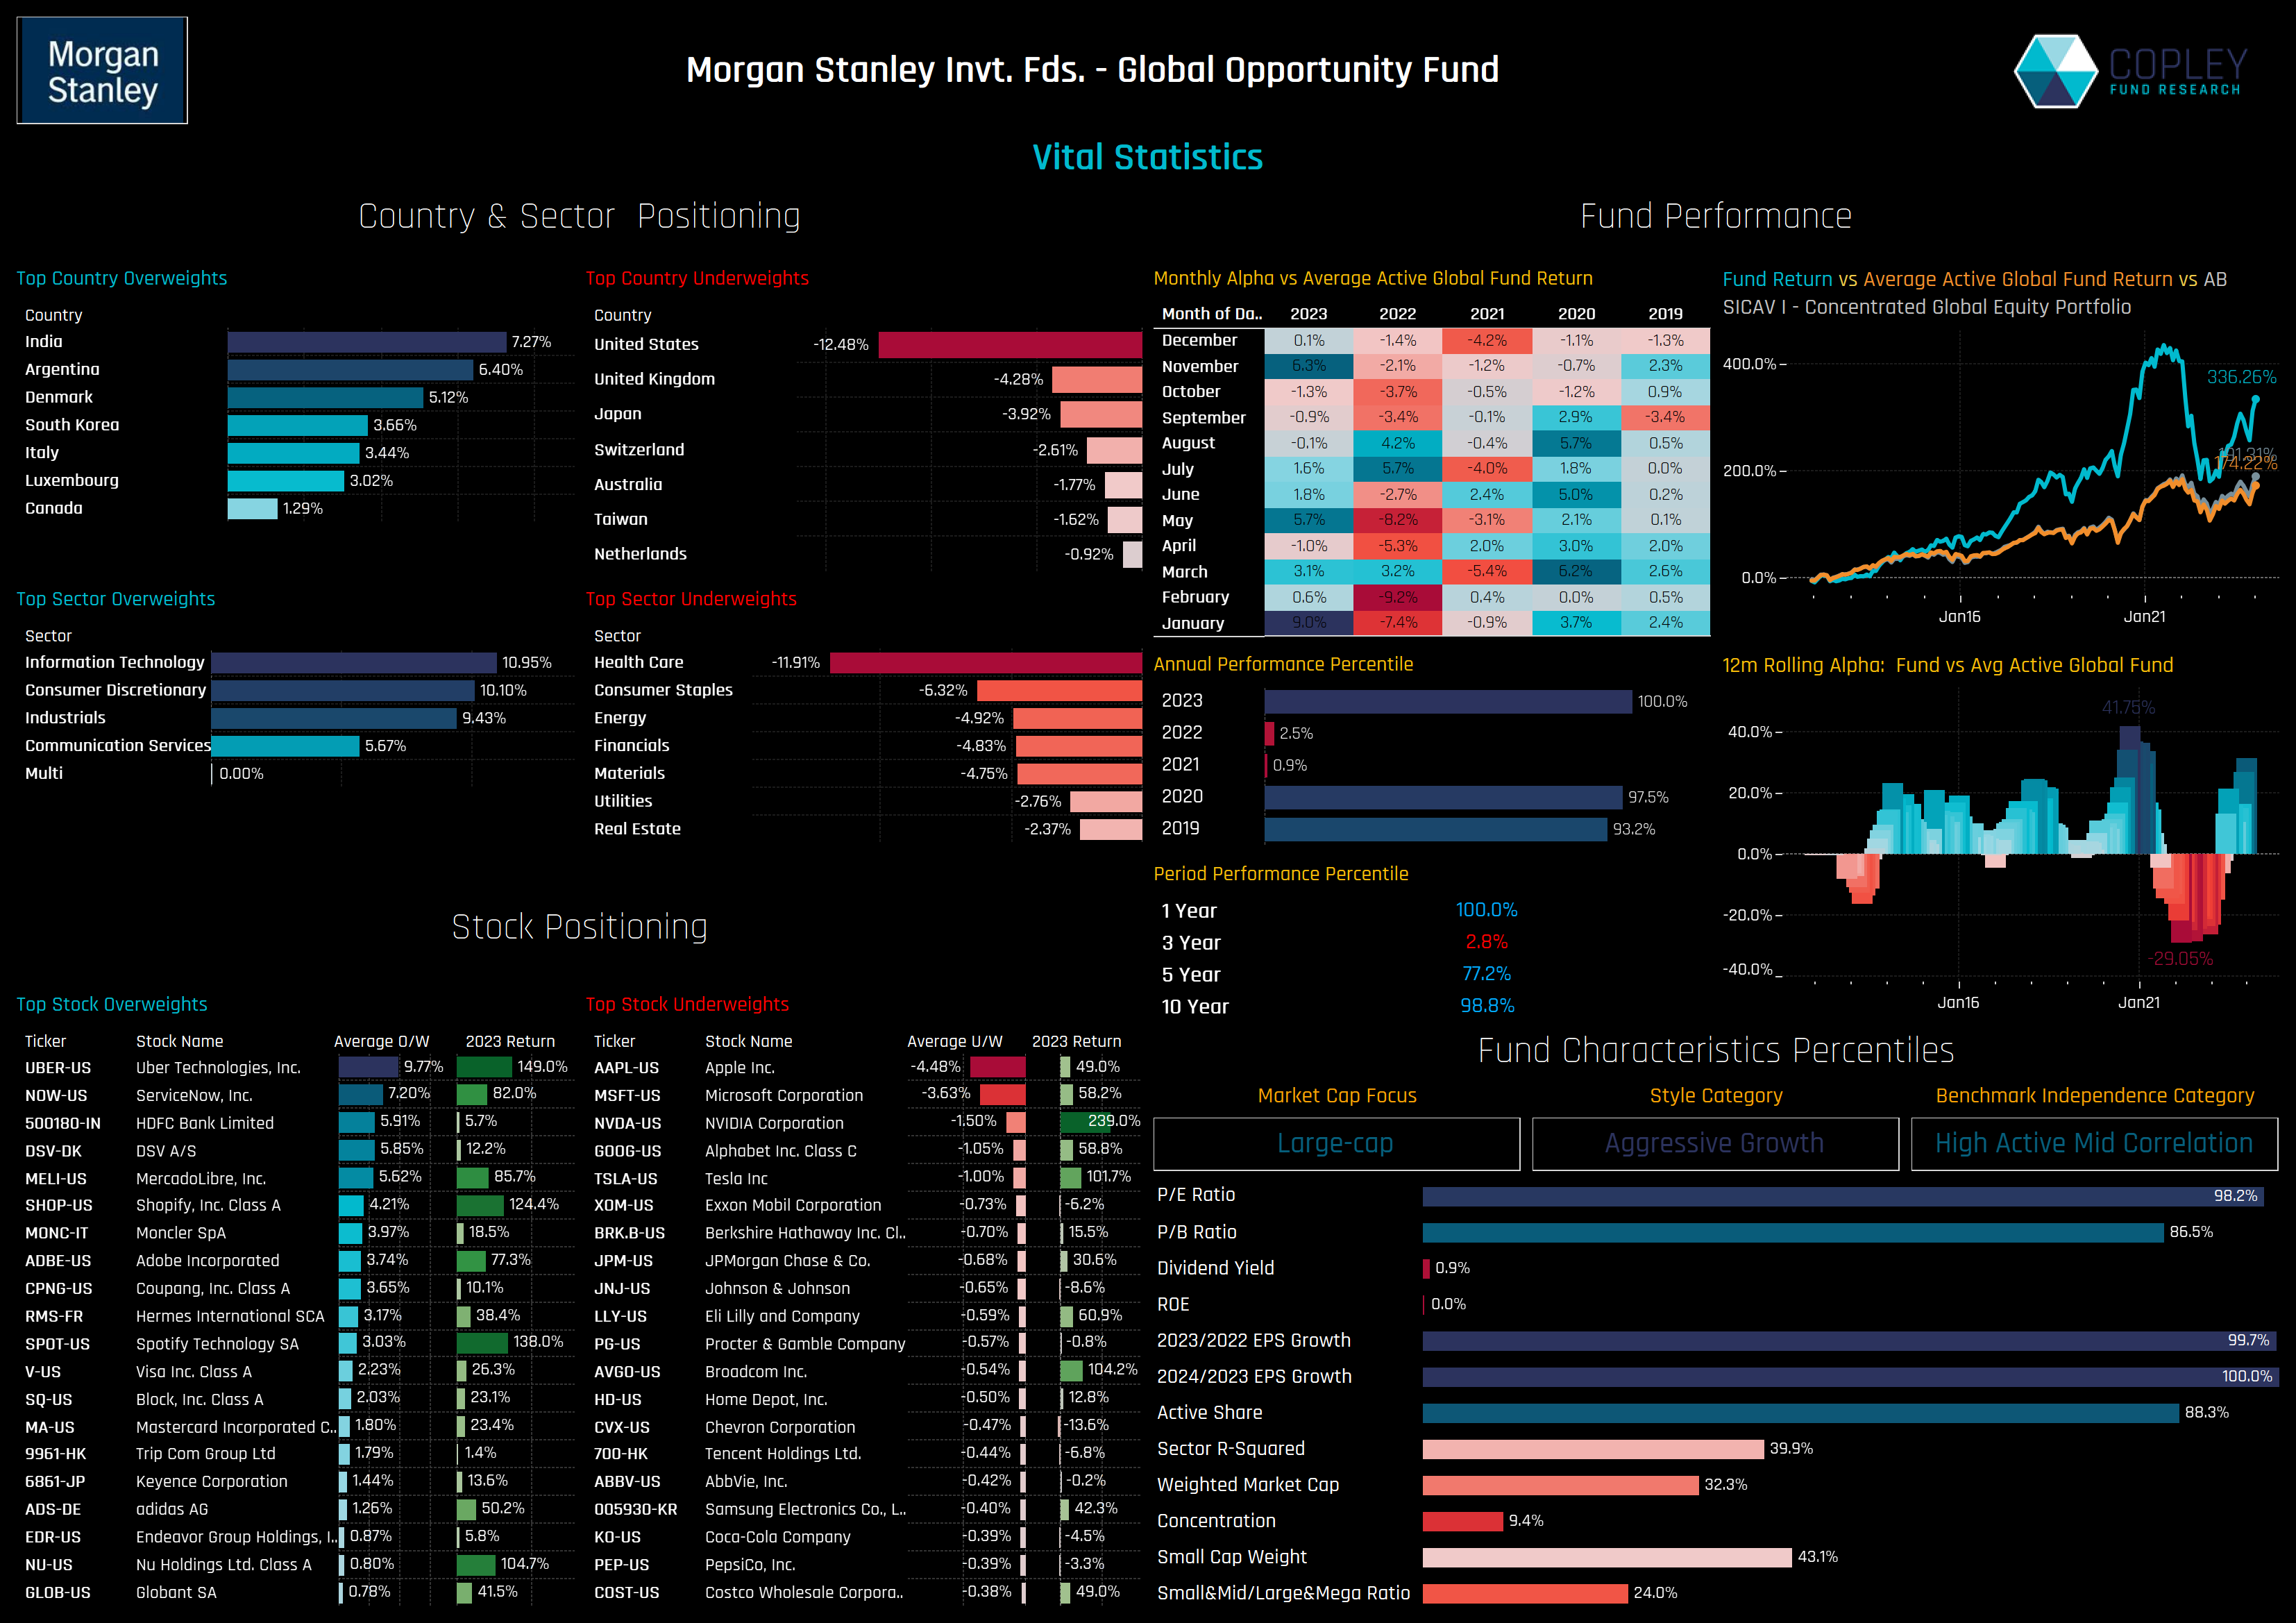
Morgan Stanley’s Global Opportunity fund topped the performance list for 2023, recovering from bottom percentile performances in 2022 and 2021. The fund is high growth and high active share, characterized by a significant USA underweight of -12.48%, used to fund overweights in India, Argentina and Denmark, among others. Driving returns in 2023 were outsized holdings in Uber Technologies, ServiceNow, Inc and Shopify, in addition to avoiding some key underperforming Energy companies.
Active vs Passive in Global Equity
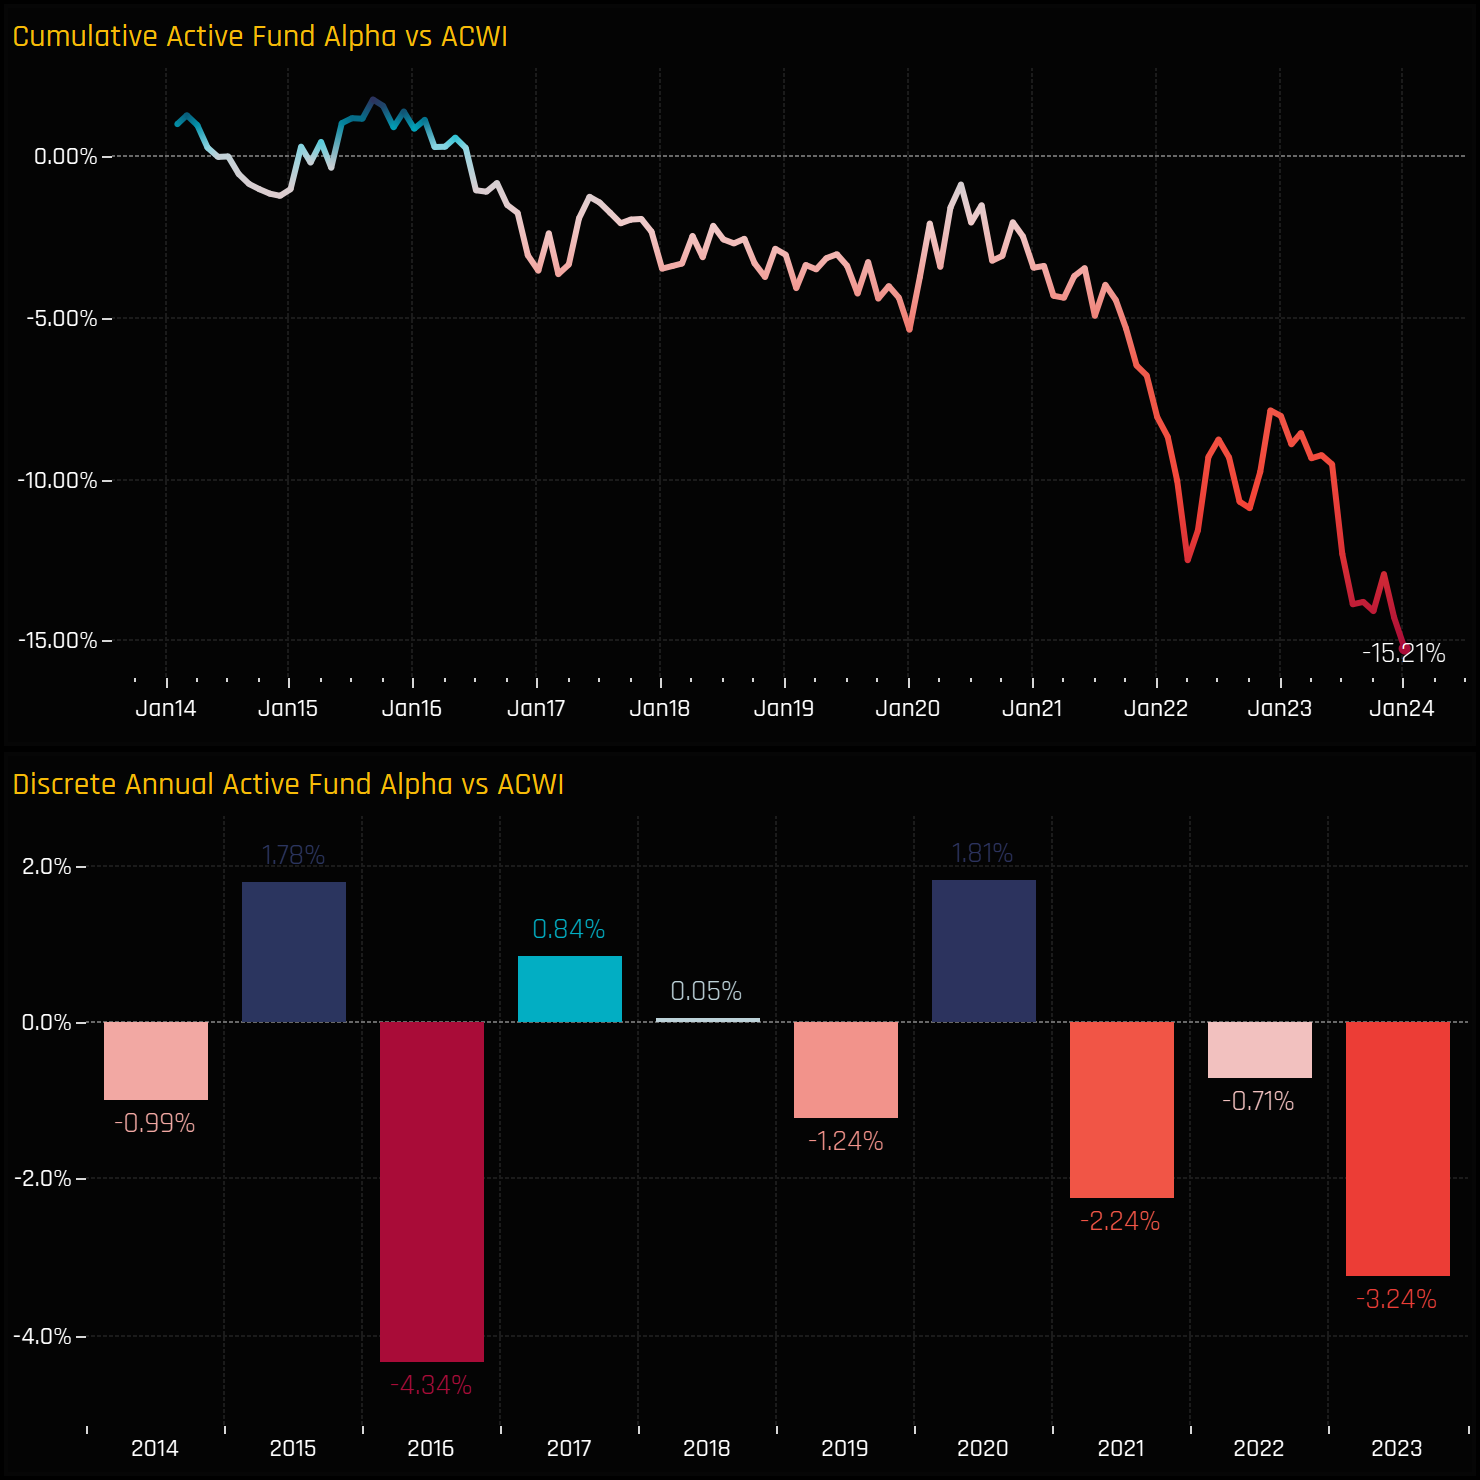
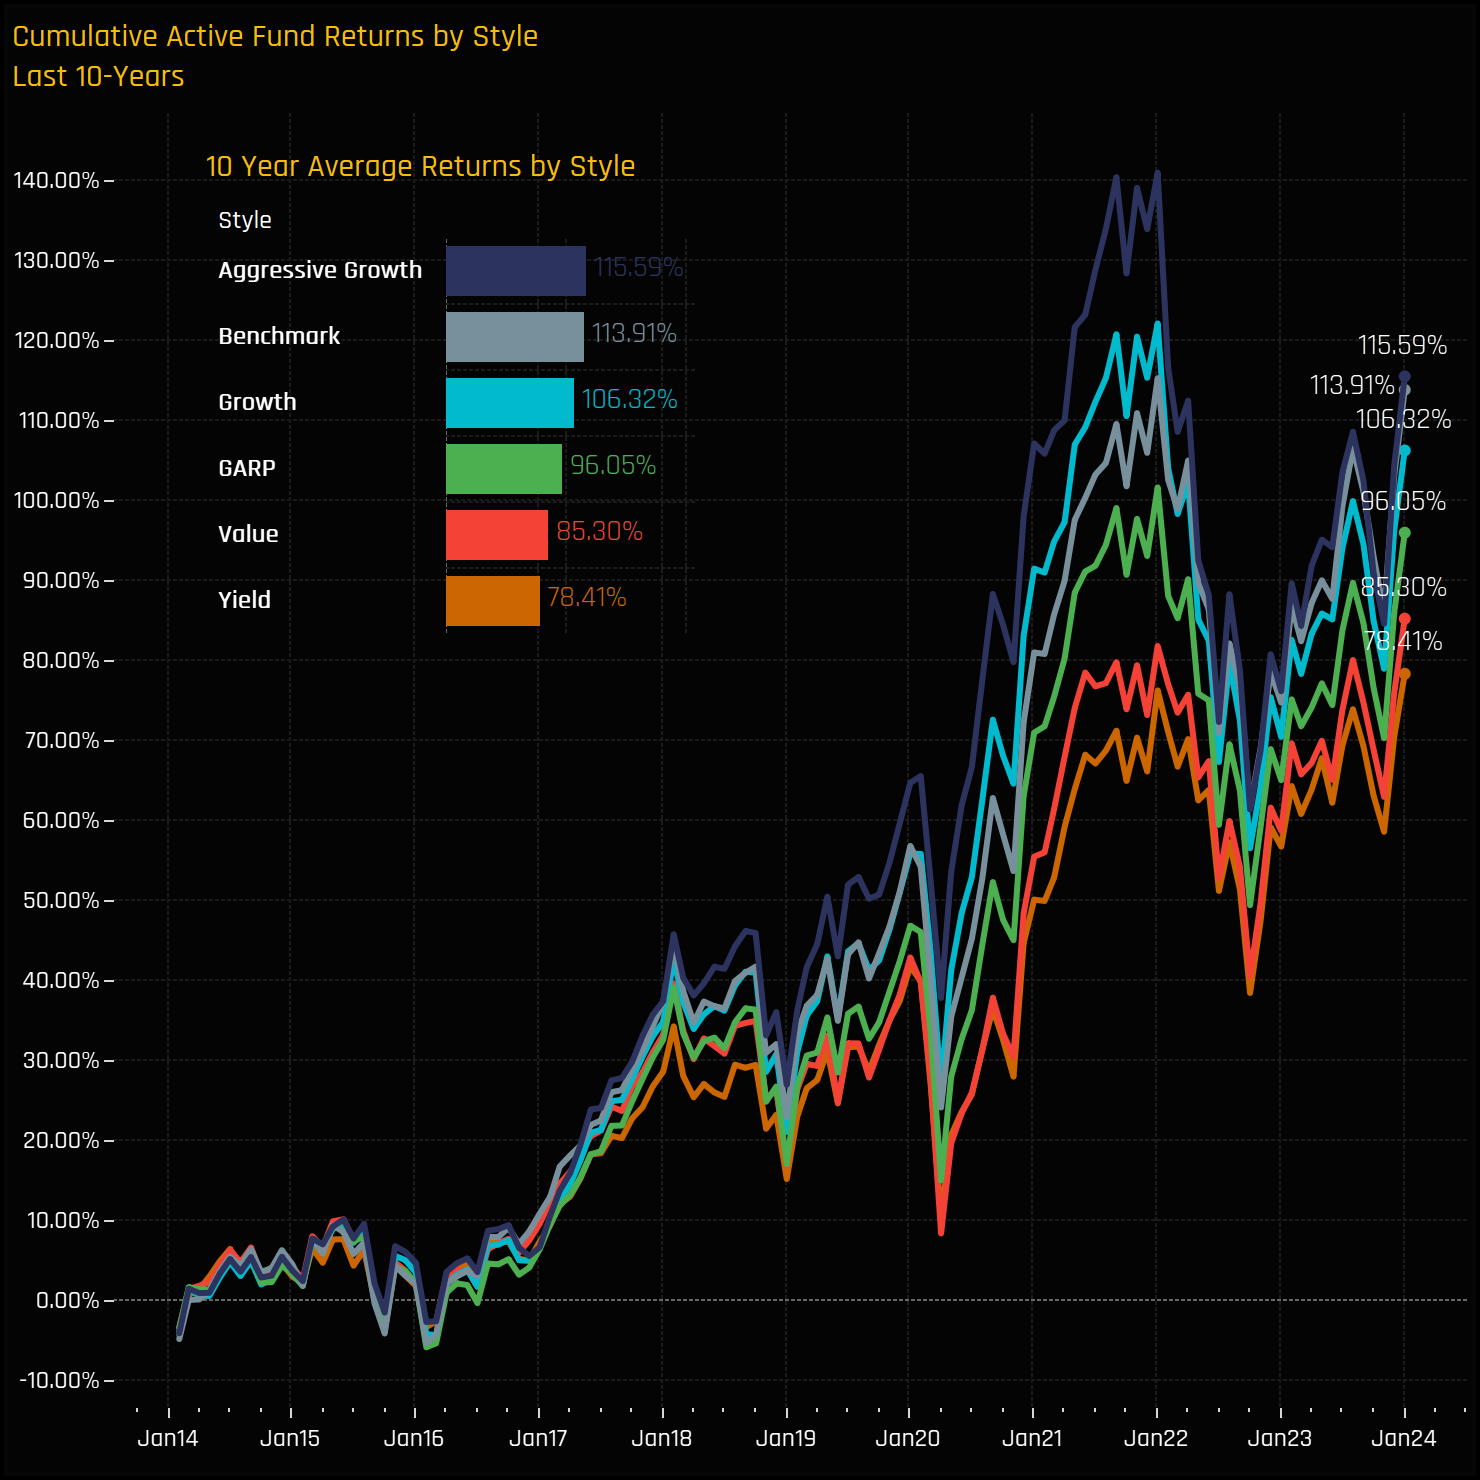
Over the past decade, Active Global Funds have underperformed the SPDRs MSCI ACWI ETF in six out of the ten years. Notably, in the years they did outperform, the margin was smaller compared to the years of underperformance, culminating in a total underperformance of -15.21% against the benchmark over the period.
It all comes down to Style again, with Value and Yield funds severely dragging down the averages. The high-growth profile of the ACWI benchmark has meant that only Aggressive Growth funds have managed to outperform in the last decade.
Portfolio Positioning & Performance
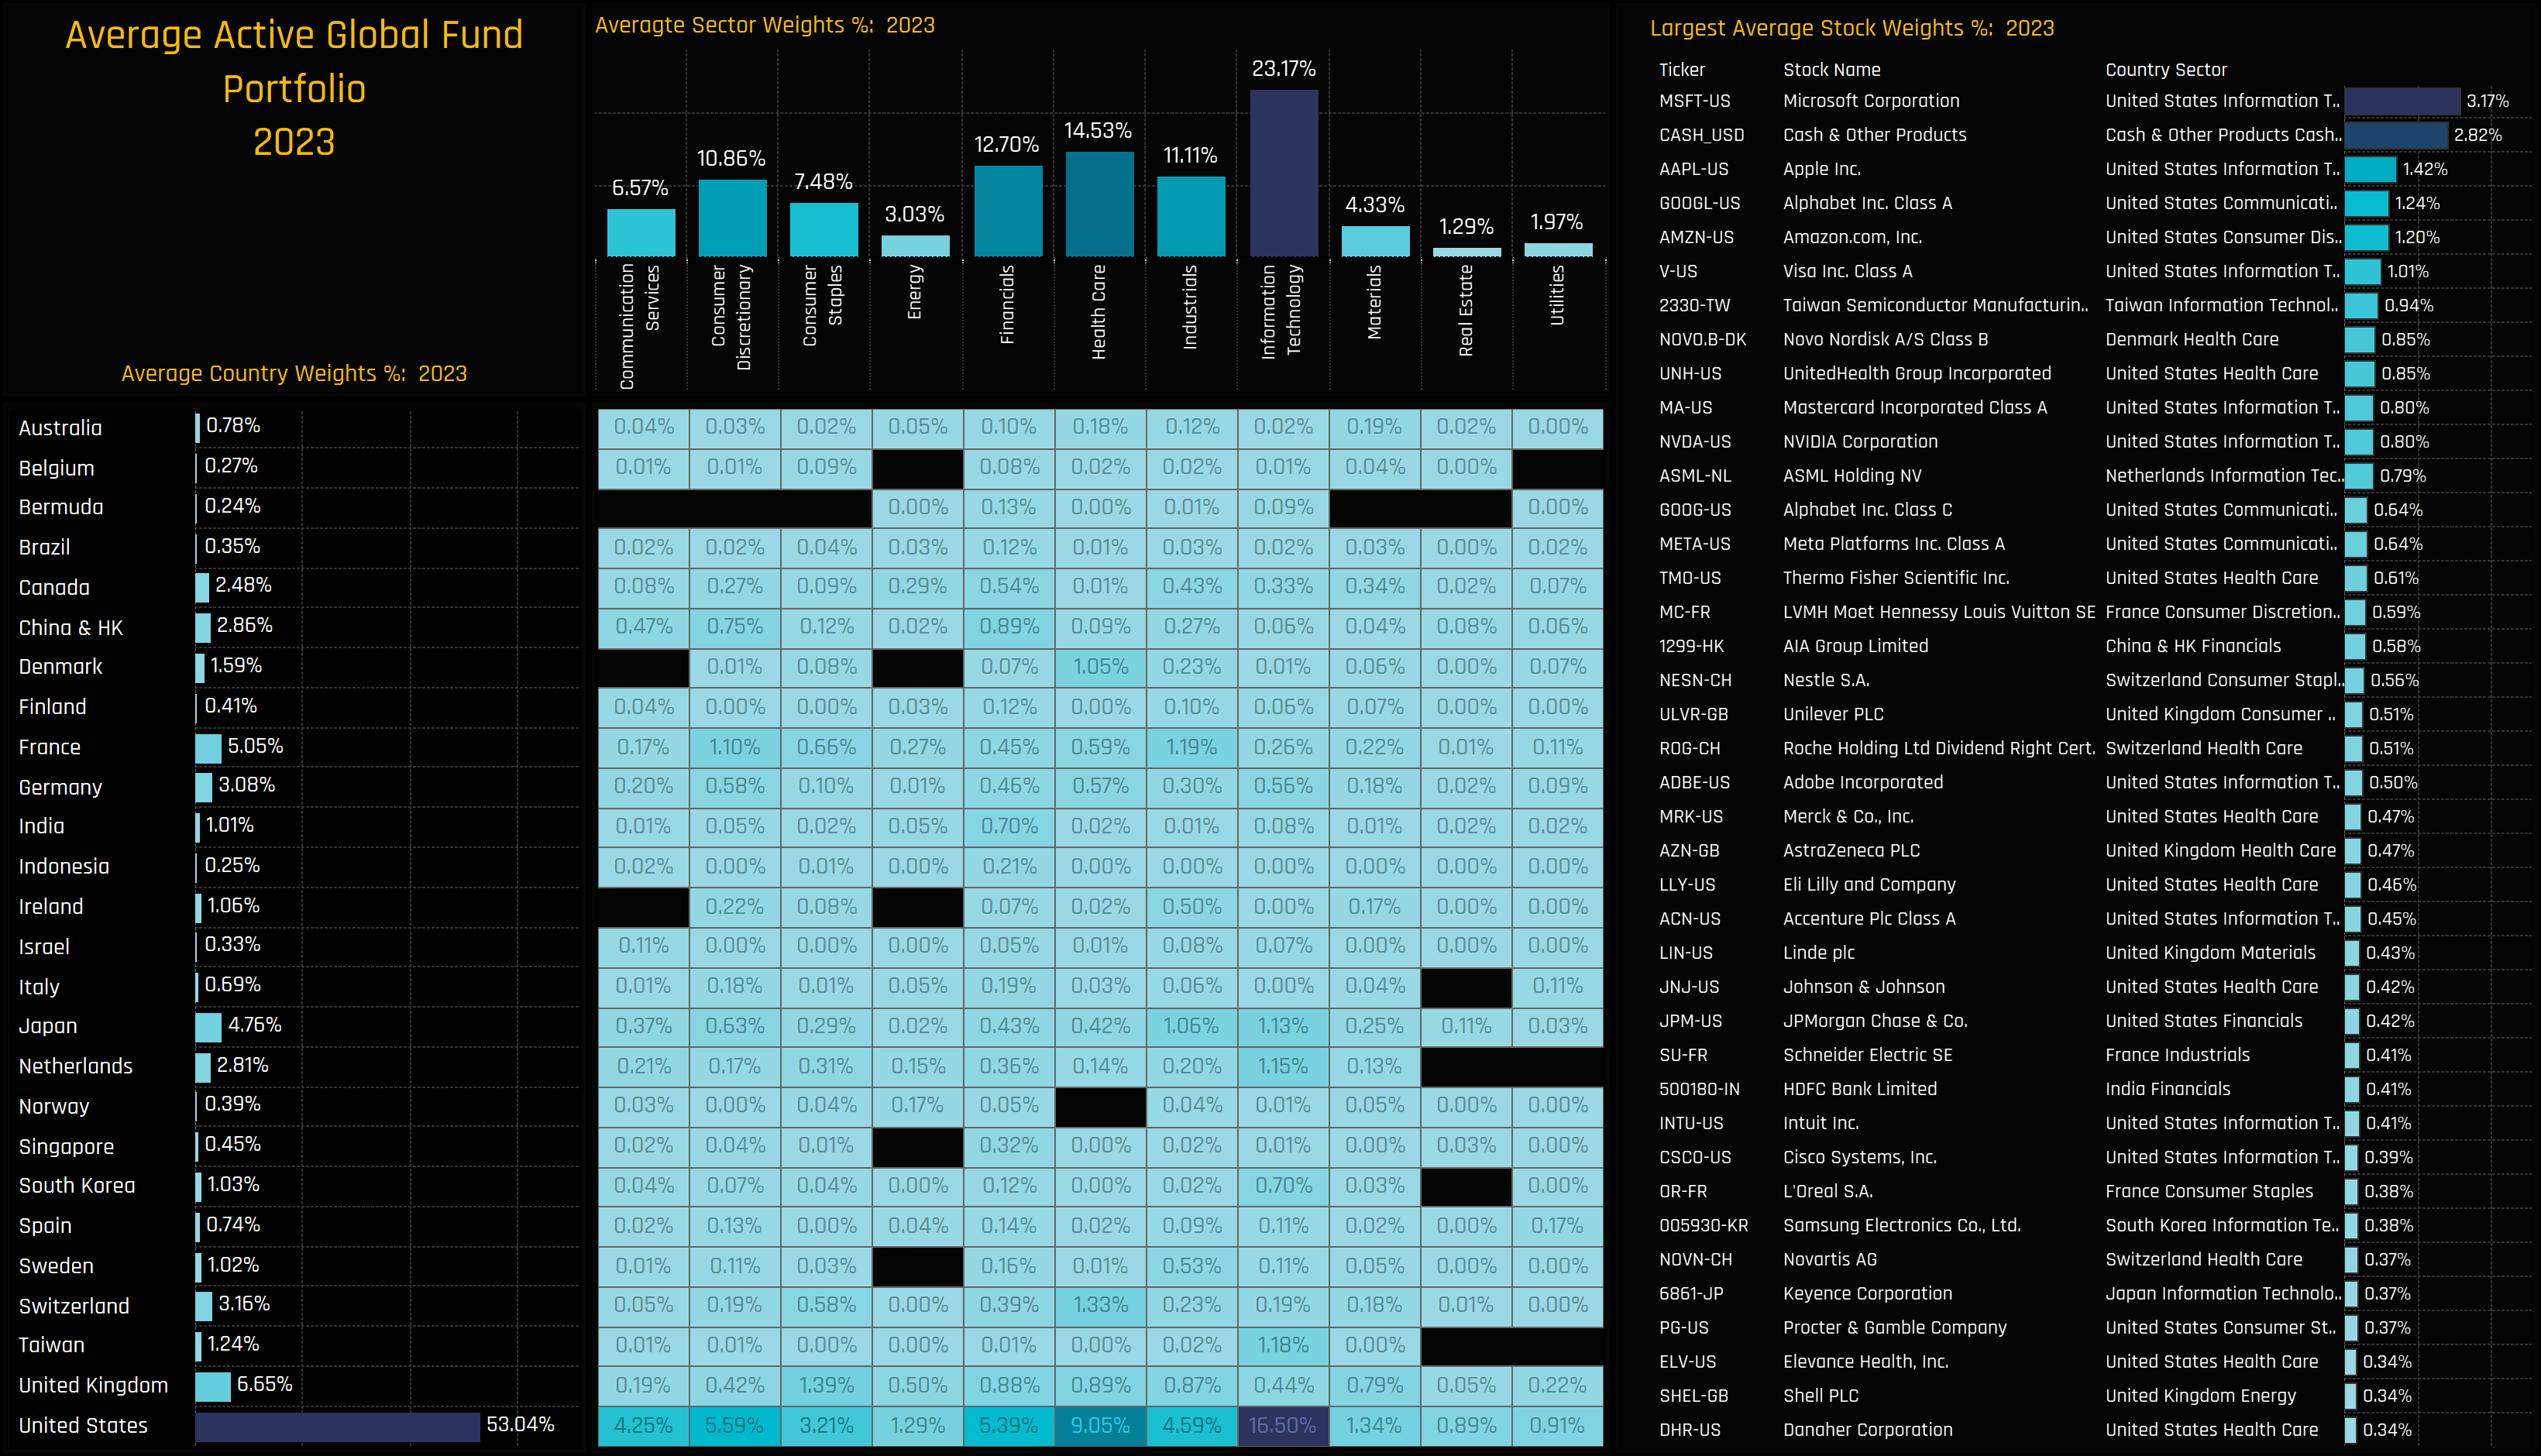
Focusing back on 2023, we now look to breakdown last year’s performance by country, sector and stock to understand the drivers behind the underperformance. We do this by analysing a portfolio based on the average holding weights of the 342 individual Global equity strategies in our analysis.
The chart below breaks down the country, sector and stock weights of this portfolio. On a sector level, Information Technology is the largest weight, with US Tech and US Health Care the dominant Country/Sector positions. The largest stock weights can be seen in the right-hand chart, and led by Microsoft Corp, Apple Inc, and Alphabet.
Portfolio Performance
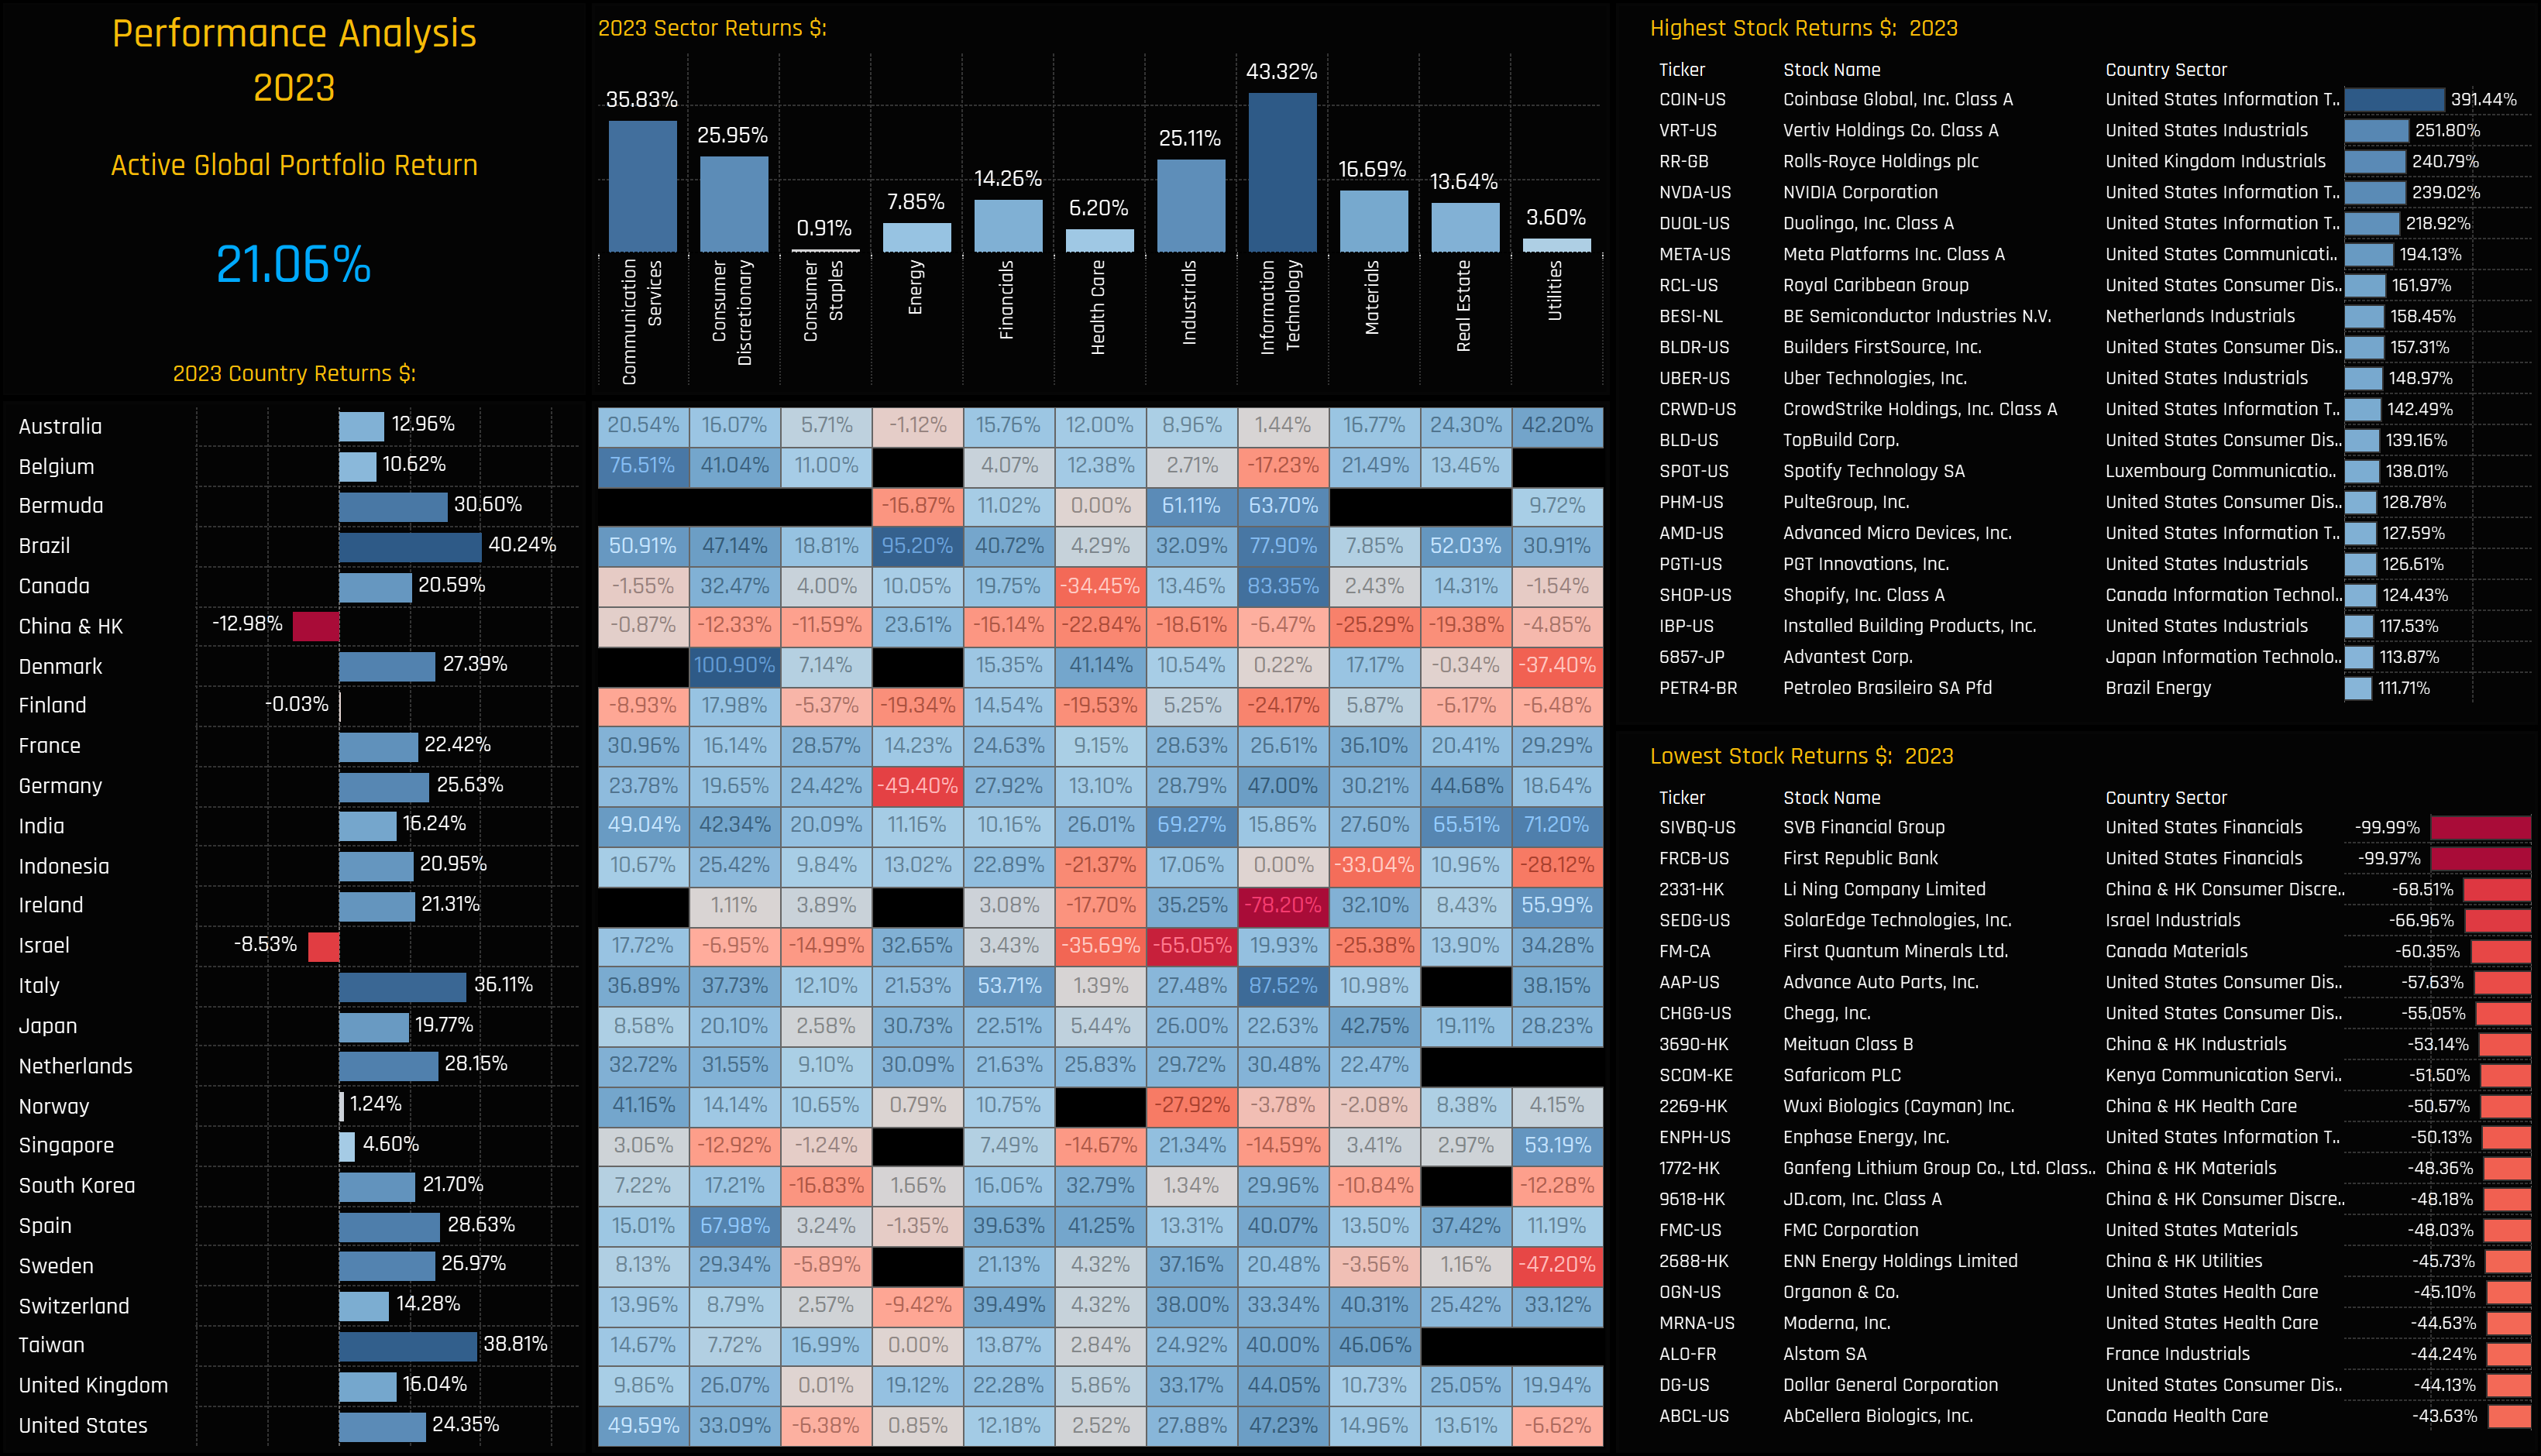
Based on monthly observations, the portfolio returned 21.06% in 2023, higher than the average actual fund returns of 19.12% mainly due to a lack of management fees and the infrequency of fund filings data (i.e this is a theoretical portfolio). The charts below show the 2023 performance of the major countries, sectors, country/sectors and stocks in the portfolio.
The big underperformance of China & HK is the most notable metric, with all Chinese sectors except Energy producing negative returns on the year. Technology performed strongly on the back of some stellar individual stock performances such as Coinbase Global and NVIDIA. In fact, all US sectors ended up in the blue with the exception of US Utilities and US Consumer Staples.
Portfolio Contribution
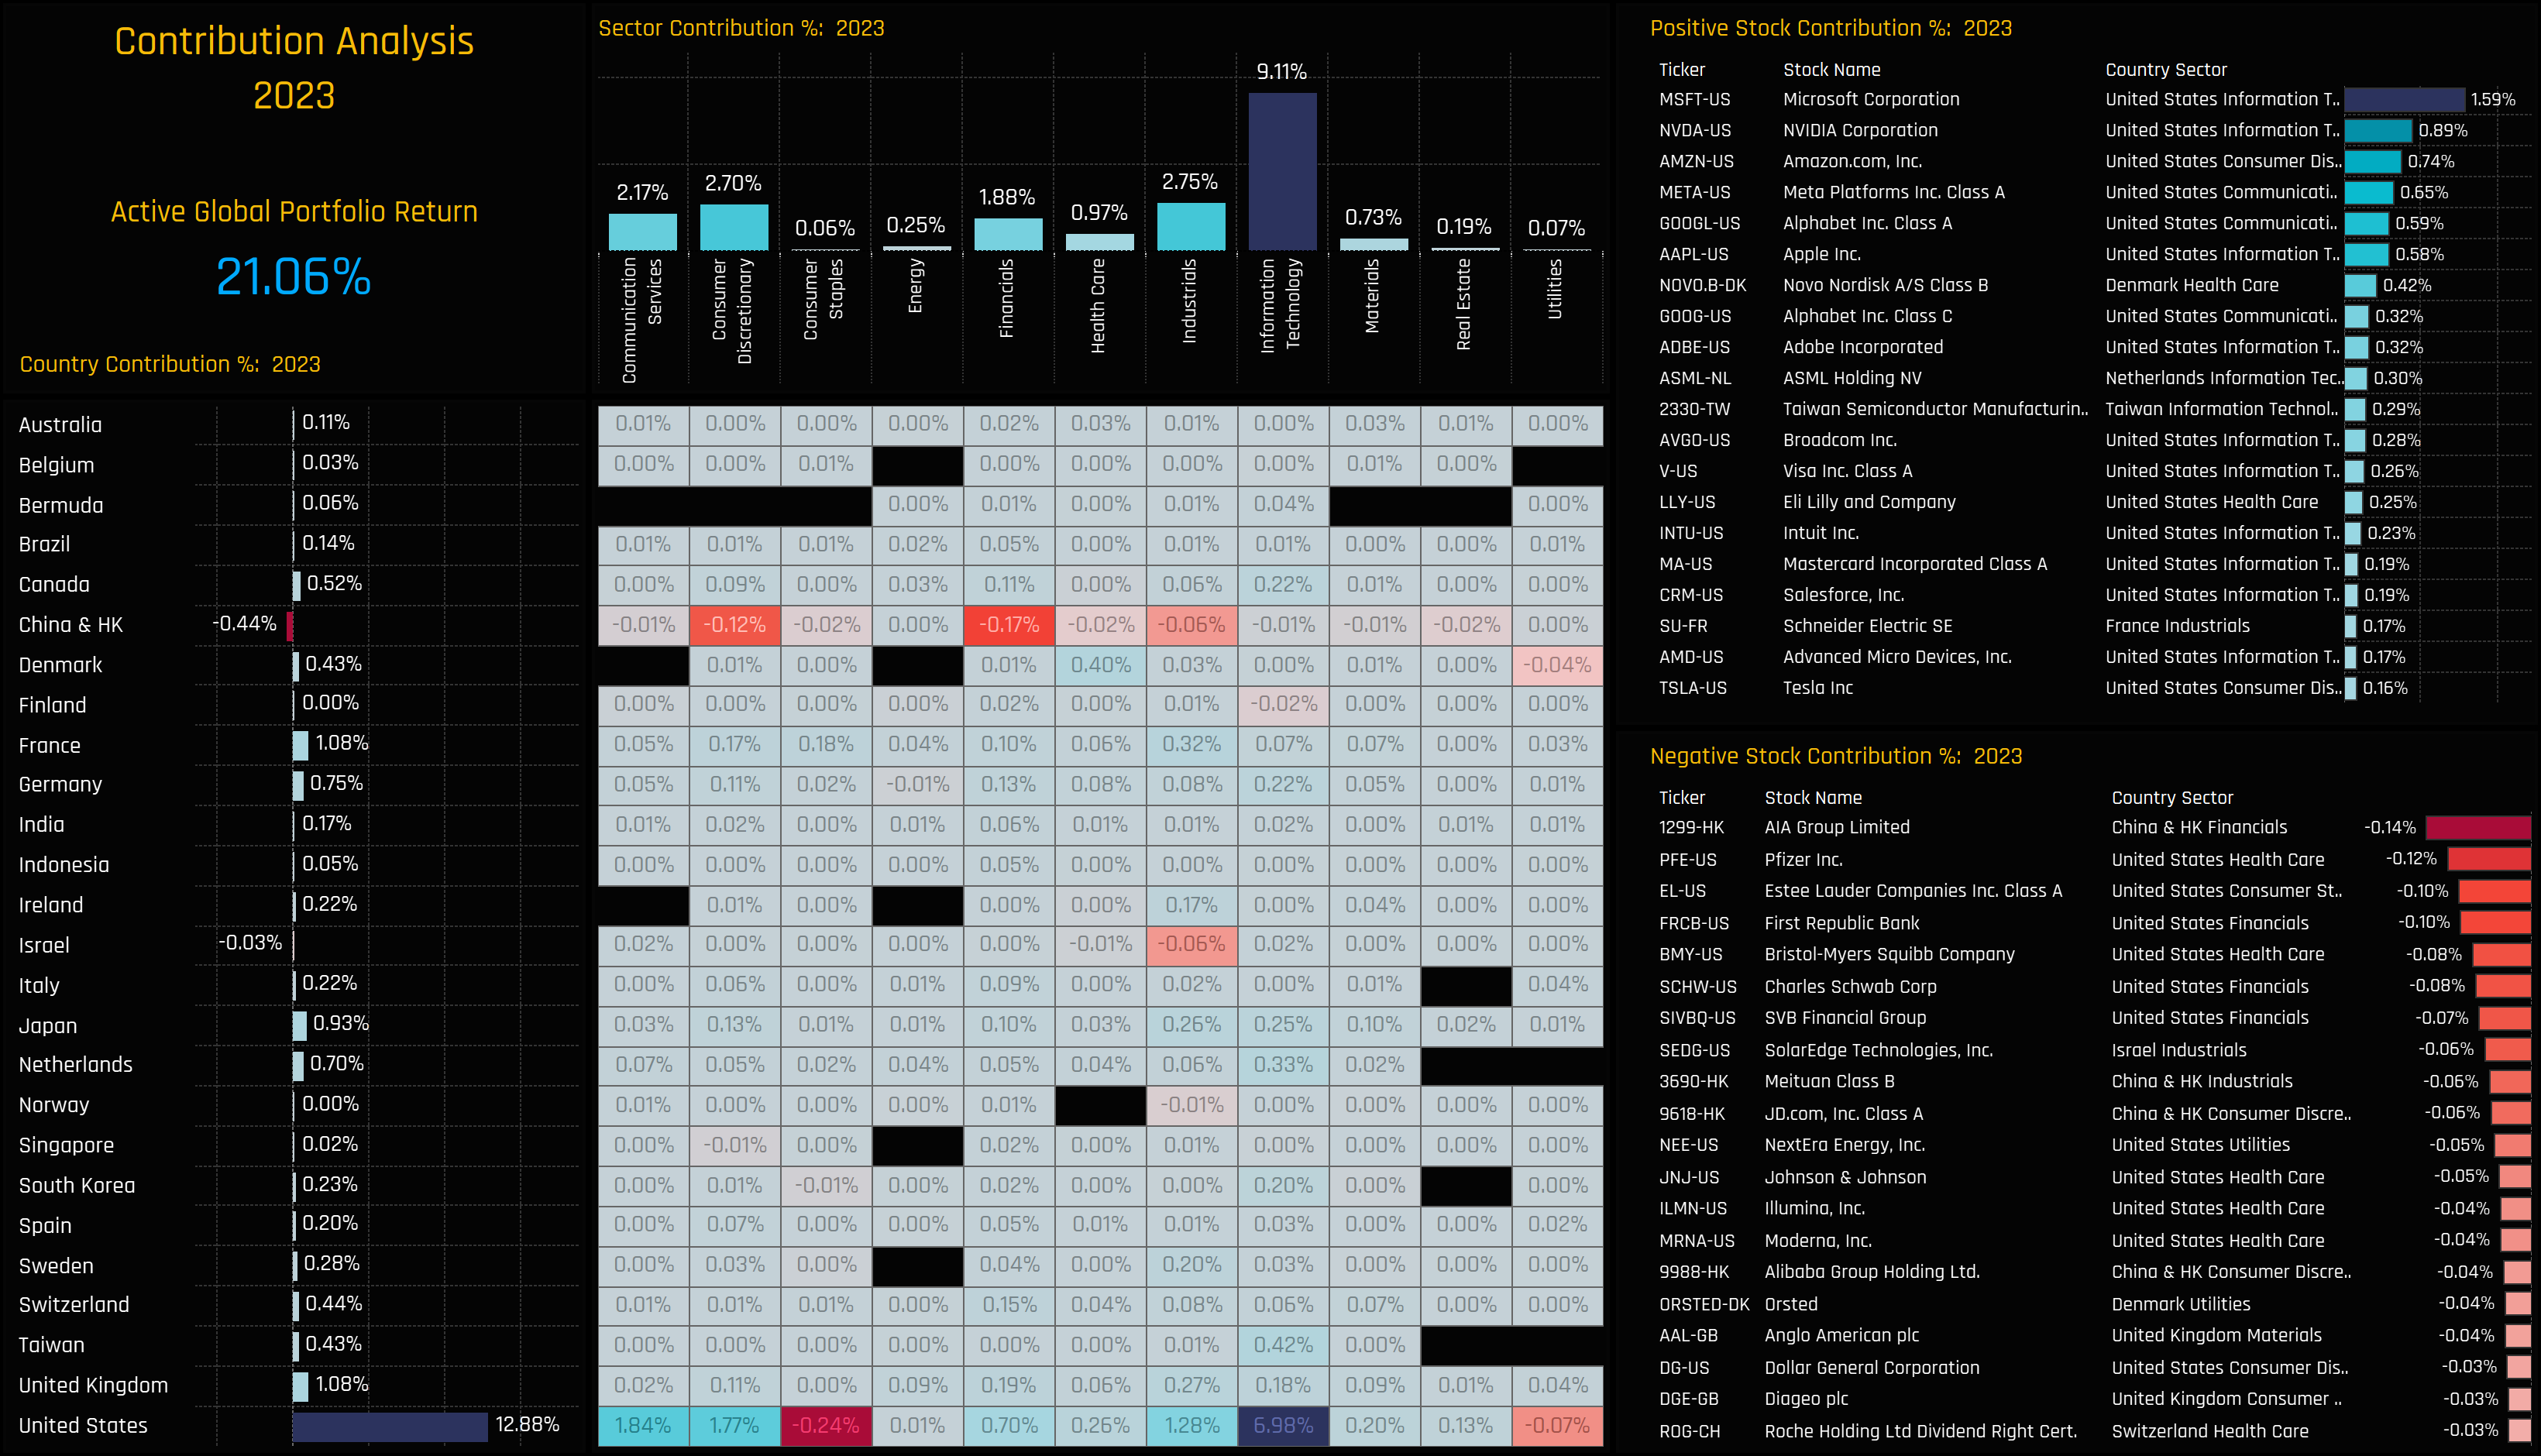
Analyzing performance data alongside average holding weights reveals the primary drivers of 2023’s returns. Except for China & HK and Israel, all countries positively impacted returns, as did all major sectors. The Information Technology sector was a principal contributor, accounting for 9.11% of the total 21.06% annual returns. This was largely due to significant input from the USA and smaller contributions from Taiwan, Japan, and the Netherlands. At the stock level, six stocks from the ‘Magnificent 7’ group were pivotal, collectively generating a 5.04% return for the average Global active manager.
Positioning Relative to Benchmark
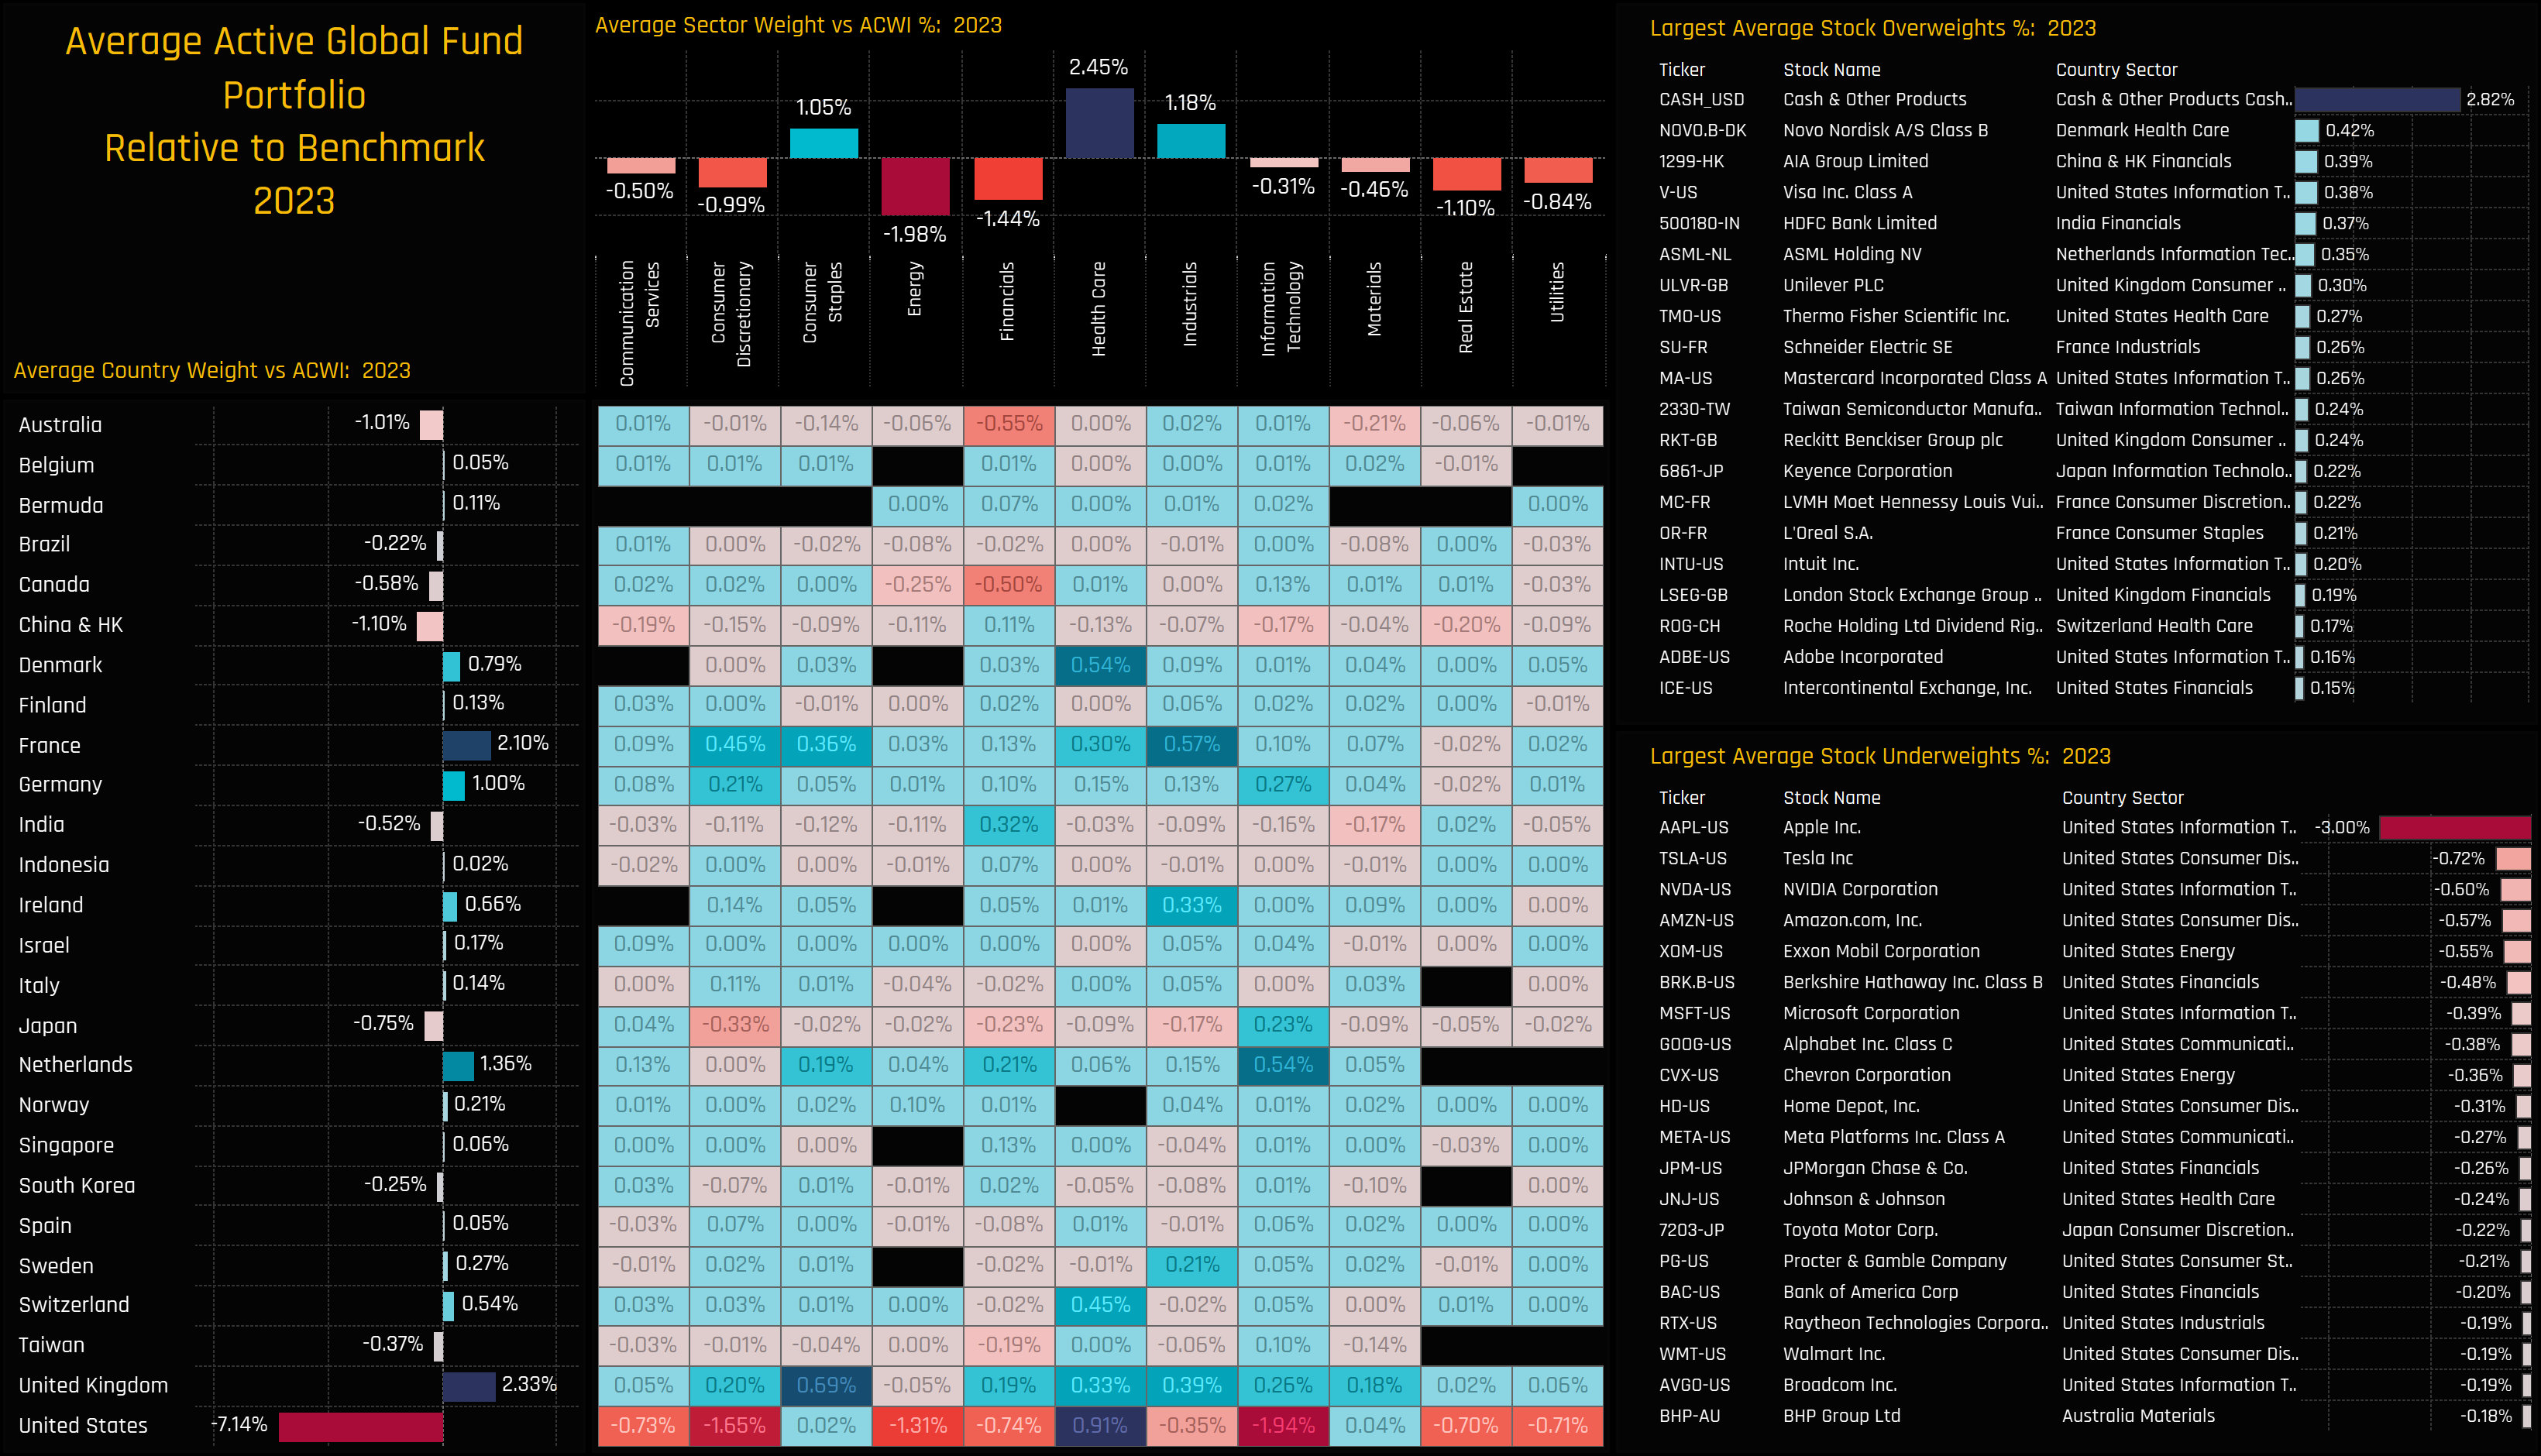
The portfolio’s positioning compared to the SPDRs ACWI ETF benchmark is detailed in the charts below. Throughout 2023, Active Global Funds maintained a significant underweight in US stocks, particularly in the Consumer Discretionary and Technology sectors. Sector-wise, overweights were in Consumer Staples, Health Care, and Industrials, with the most notable underweights in Energy and Financials.
Outside of the USA, the major Asian countries were underweighted, balanced by overweights in key European nations. At the stock level, the most significant overweights included Cash, Novo Nordisk, AIA Group, and Visa Inc. The underweights were led by a substantial -3% relative position in Apple Inc, followed by smaller underweights in Tesla Inc and NVIDIA Corp.
Performance Attribution
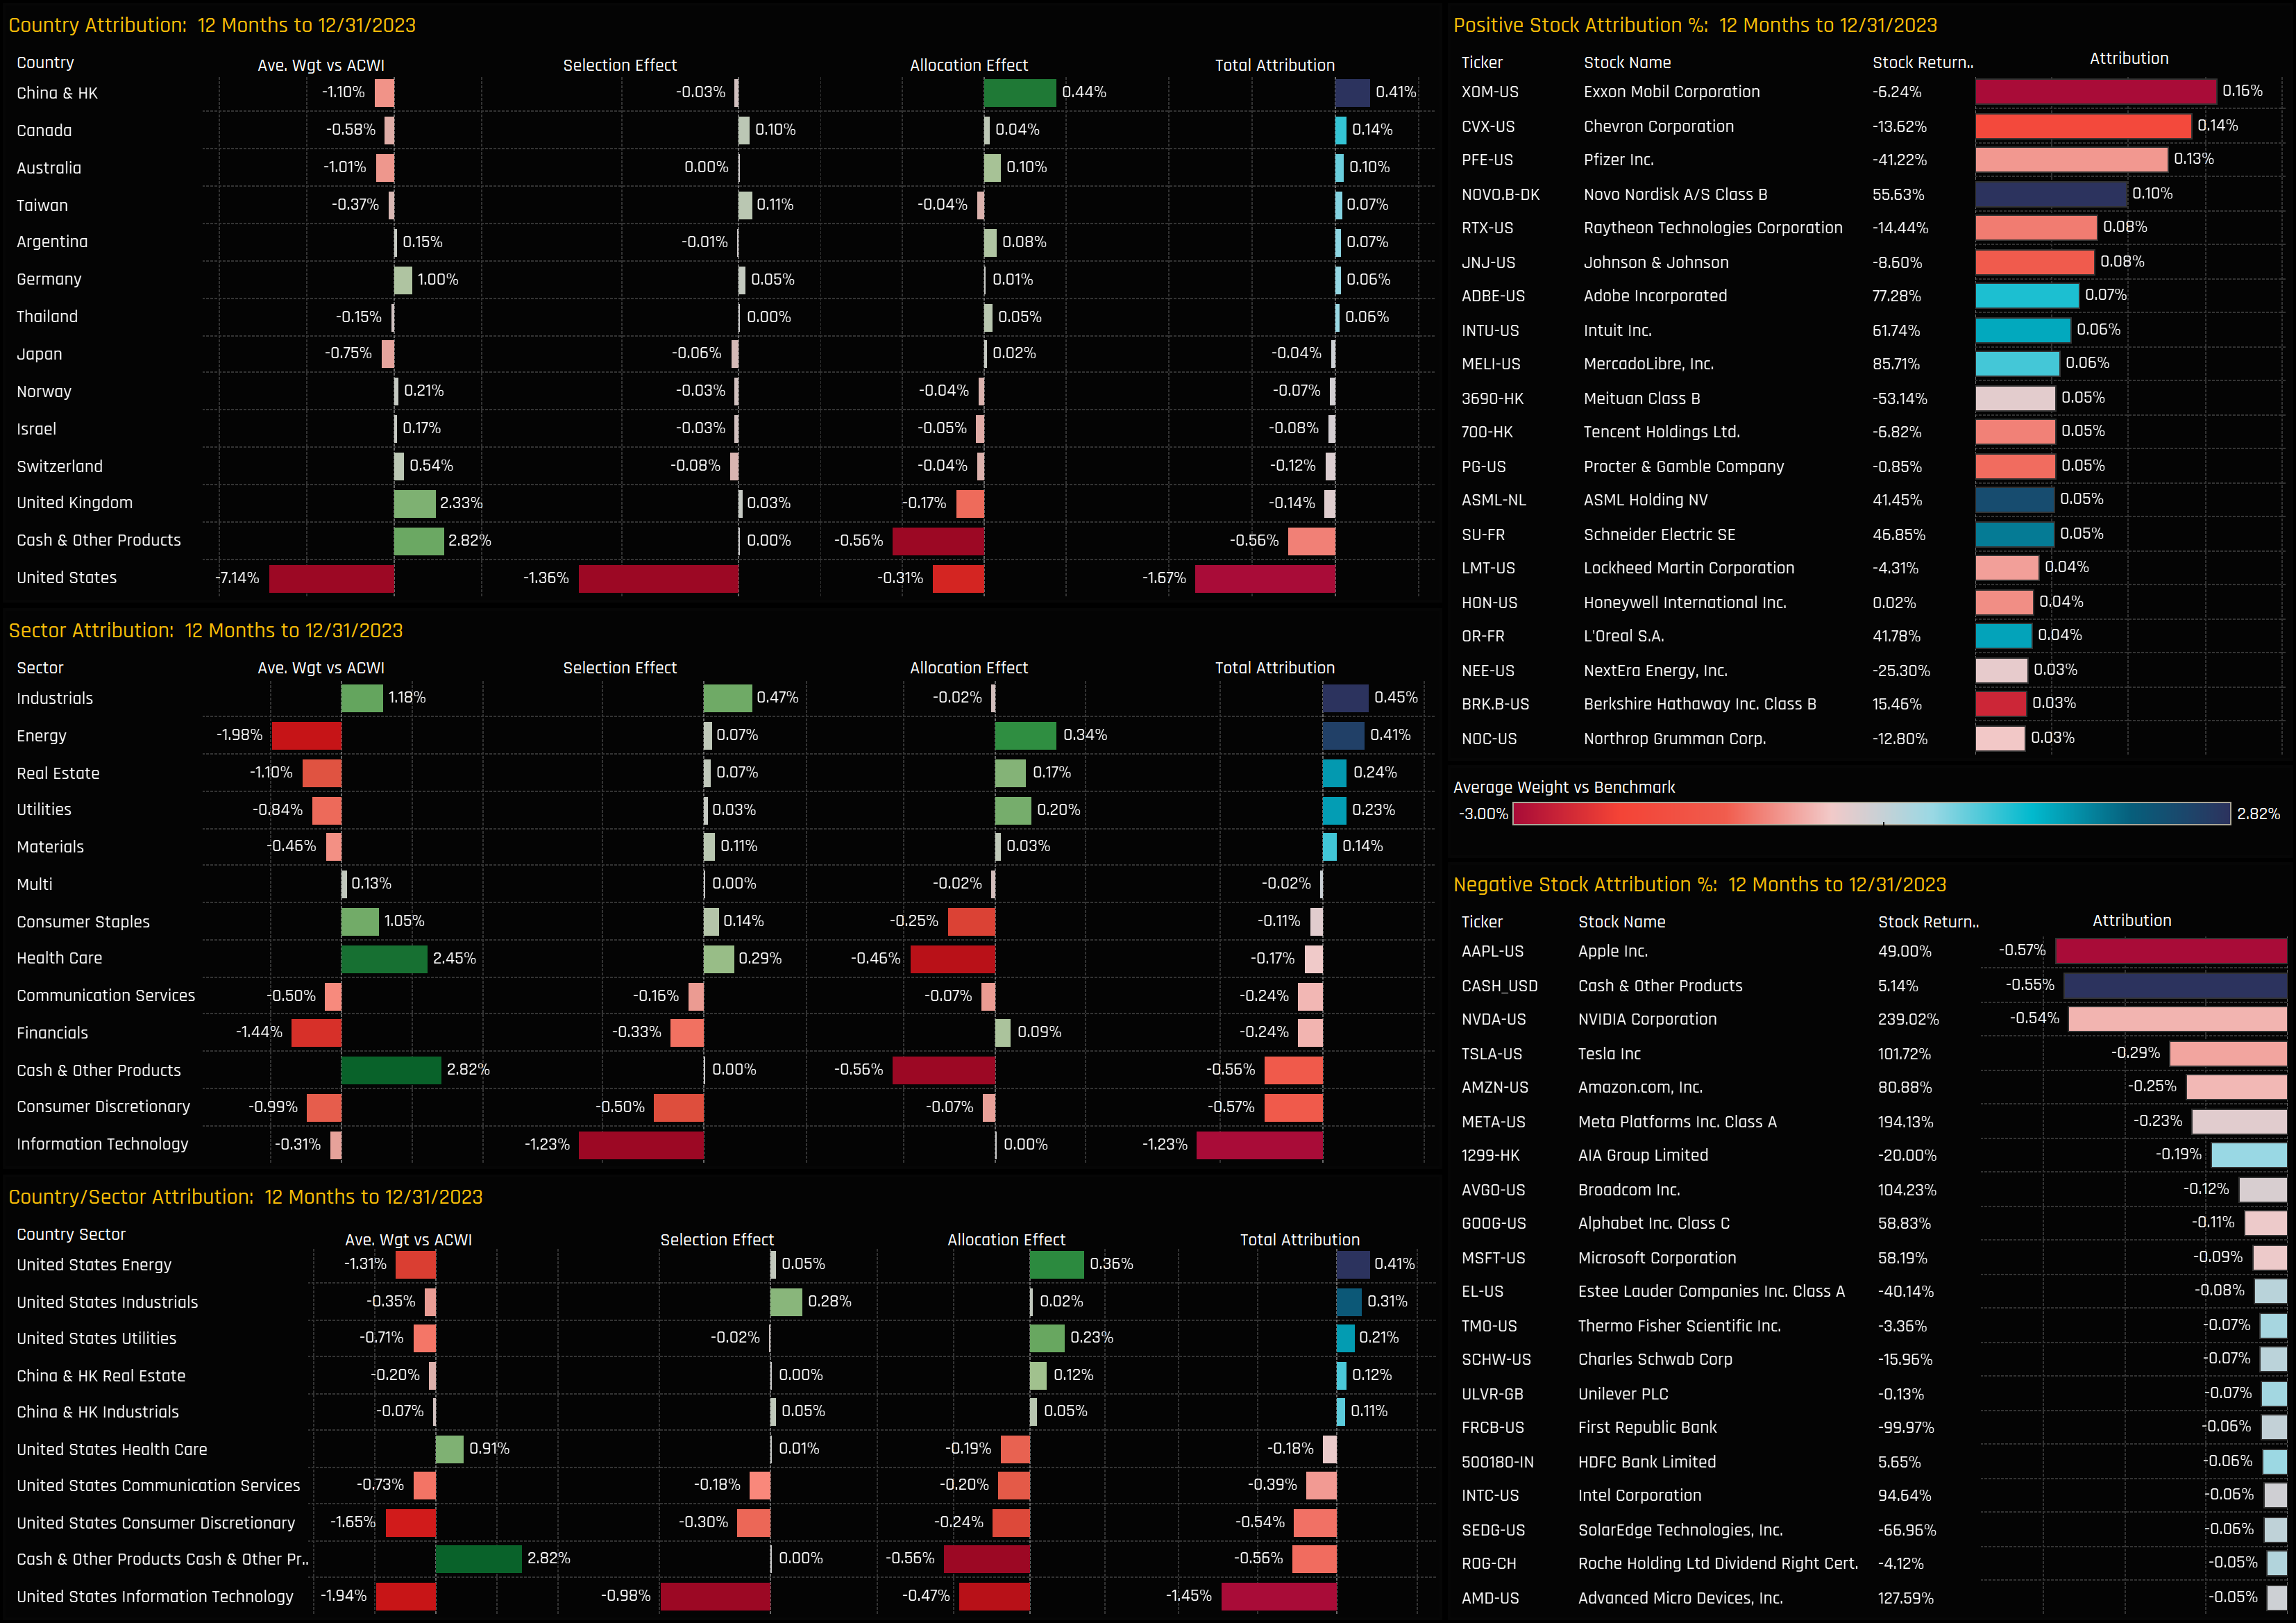
Our attribution analysis compares this portfolio against a benchmark represented by the SPDRs MSCI ACWI ETF. Consistent with the overall fund underperformance in 2023, the portfolio lagged by -1.67%. A critical factor in last year’s underperformance was positioning in the United States. The underweight position in the U.S. market dragged on relative returns, and poor stock selection further exacerbated the issue. A detailed summary of the key factors contributing to this underperformance is provided below.
What worked:
- Underweights in Energy, Real Estate, Utilities, China & HK
- Overweights in Industrials
- Stock selection in Taiwan, Health Care, Industrials, Canada
- Underweights in Exxon Mobil, Chevron and Pfizer
- Overweights in Novo Nordisk, Adobe Inc and Intuit
What Didn’t:
- Underweights in the USA, Consumer Discretionary, Communication Services
- Overweights in the UK, Cash, US Health Care
- Stock selection in the USA, Technology, Consumer Discretionary
- Underweights Apple, NVIDIA, Tesla
- Overweights in AIA Group, Estee Lauder, Therma Fisher Scientific.
For more analysis, data or information on active investor positioning in your market, please get in touch with me on steven.holden@copleyfundresearch.com
Related Posts

- Steve Holden
- July 17, 2024
Global Funds: Performance & Attribution Review, Q2 2024
330 Global funds, AUM $1.1tr Global Funds: Performance & Attribution Review, Q2 2024 Summa ..

- Steve Holden
- August 18, 2024
Global Funds: Positioning Insights, August 2024
329 Global active equity funds, AUM $1.1tr Global Funds: Positioning Insights, August 2024 Summ ..

- Steve Holden
- December 21, 2023
Magnificent 7 Deep Dive
342 Global Equity Funds, AUM $990bn Riding High: The Magnificent 7 Surge in Global Equity Funds ..

