Copley Fund Research Fund Positioning Chart Pack. October 2023
- Steve Holden
- 0 Comments
Time Series Analysis & Country Drivers
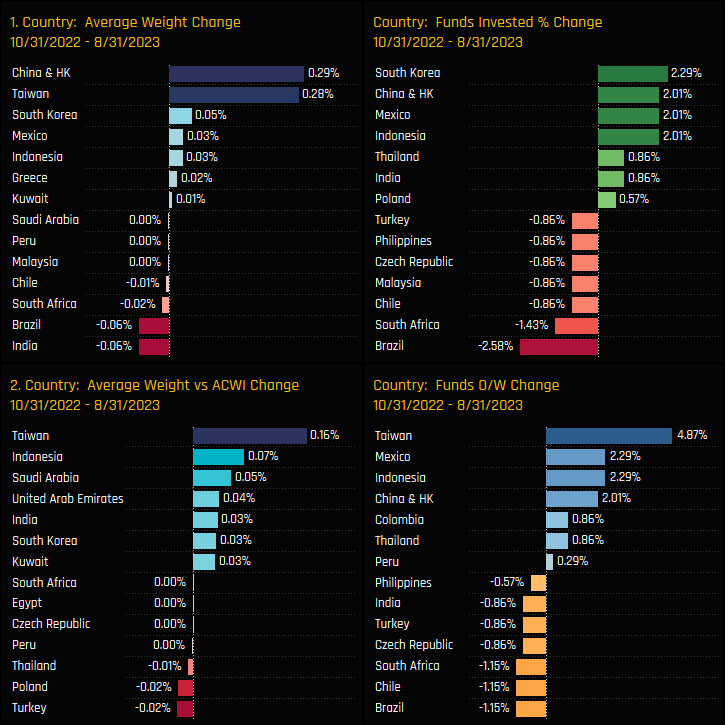
The countries driving this rotation? Fund activity between 10/31/2022 and 08/31/2023 shows China & HK and Taiwan as the drivers behind the moves higher in average weight (ch1), though the decrease in EM underweight was caused by rotation in to Taiwan and Indonesia (ch2). In LATAM, Mexico was a notable recipient of inward rotation whilst Global funds scaled back their Brazilian exposure. In our full analysis, we find that Global funds hold 83% of their total EM allocation in the big 4 of China & HK, Taiwan, South Korea and India, with China the dominant country by a margin.
Summary
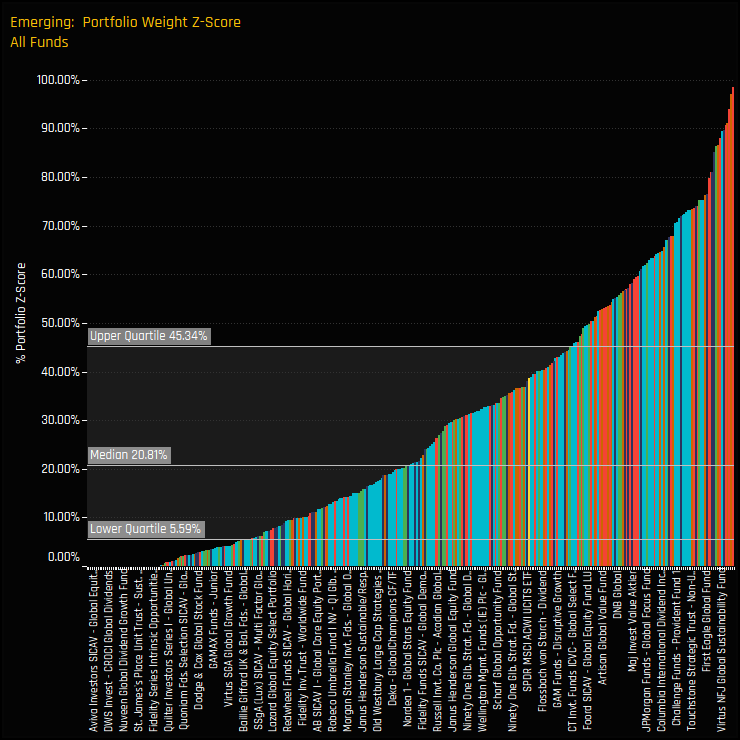
The chart to the right shows the Z-Score of each fund’s current weight in EM compared to all historical values going back to 2012. A Score of 100% means today’s weight is the highest on record for that fund, 0% the lowest. The quartile values tell the story, with half of the managers in our analysis at a Z-score of 20.8% or less, and 75% with a Z-Score of 45.3% or less. In short, managers are lightly positioned compared to their own history.
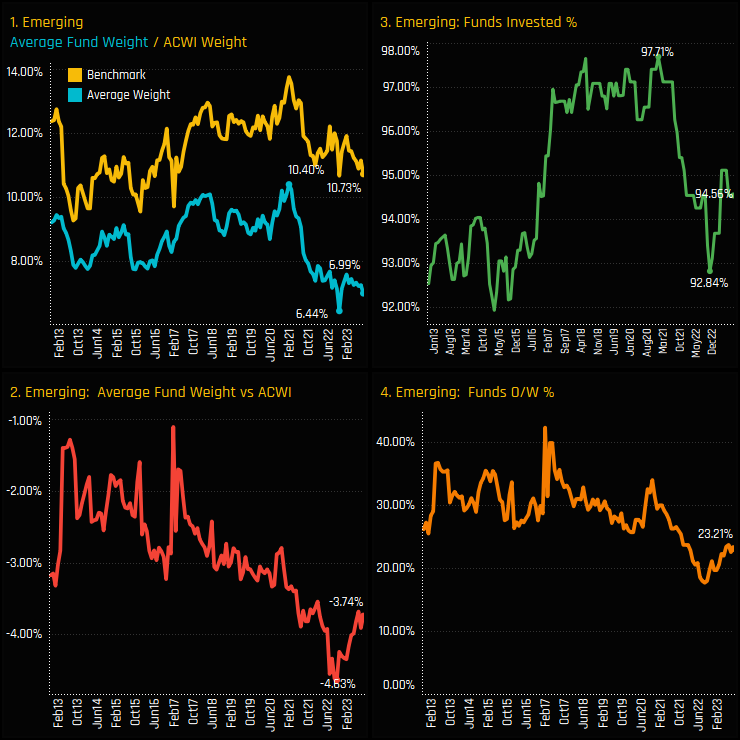
It’s almost hard to believe that despite all the coverage and buzz around emerging markets this year, they only make up 6.99% of the average global portfolio. Although ownership is no longer declining, the recent uptick feels more of a cautious step rather than a full-on turn in sentiment. The fact remains that 77% of the global funds in our analysis are positioned for underperformance – we’re a long way from bullish positioning in EM.
In the full analysis we look at individual fund exposures in EM and see which managers have been increasing and decreasing their EM allocations this year. Also, we drill down in to the stock holdings that underpin the current EM allocation. You might be surprised to learn that only 6 EM companies are owned by more than 10% of the Global funds in our analysis, and those 6 companies account for 38% of the total EM allocation.
Time Series Analysis & Market Cap Split
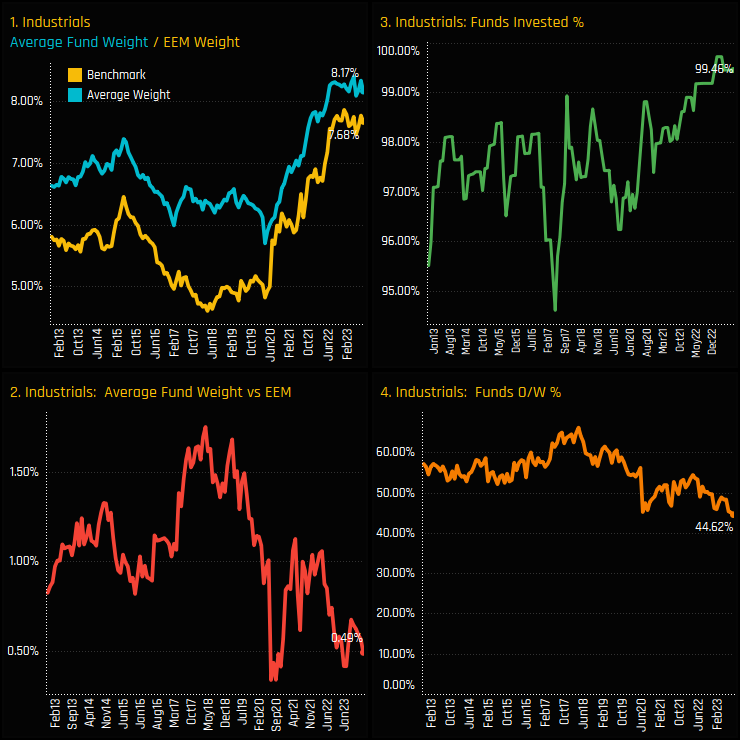
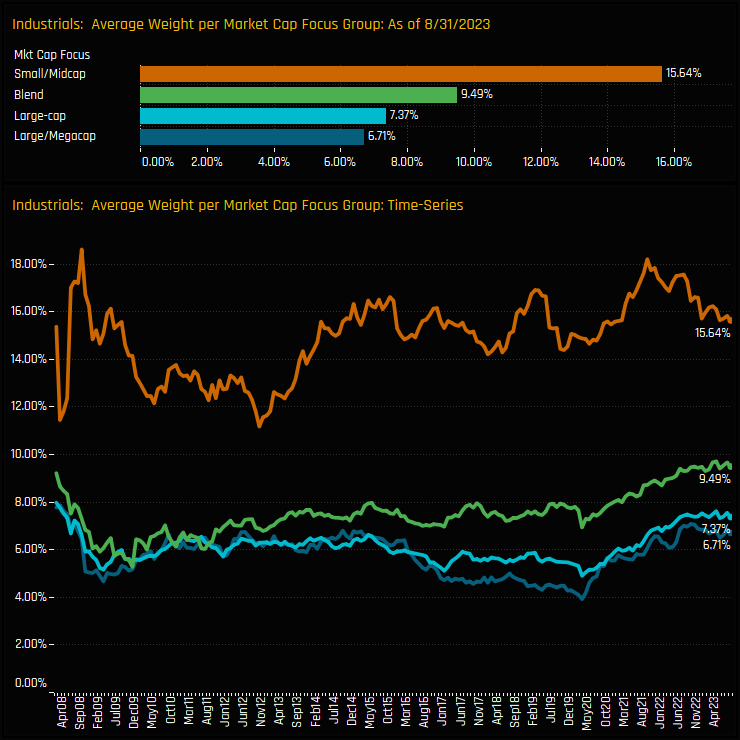
If we break down that average weight figure by the Market Cap focus of the fund, we find that Small/Midcap strategies have long allocated more than their larger cap peers in the Industrials sector. Average weights among the 19 Small/Midcap strategies in our analysis stand at 15.64%, more than double that for both Large/Megacap and Large-Cap funds. However, the time-series chart shows how the growth in Industrials weights since 2020 has been mainly driven by Large/Mega, Large-Cap and Blend Strategies, who are all close to record levels of exposure.
Summary
Industrials exposure among active Emerging Market funds appears to be at a consolidation point. The momentum that took average weights from sub-6% in 2019 to 8%+ today has faded, though there are no signs of a full scale reversal.
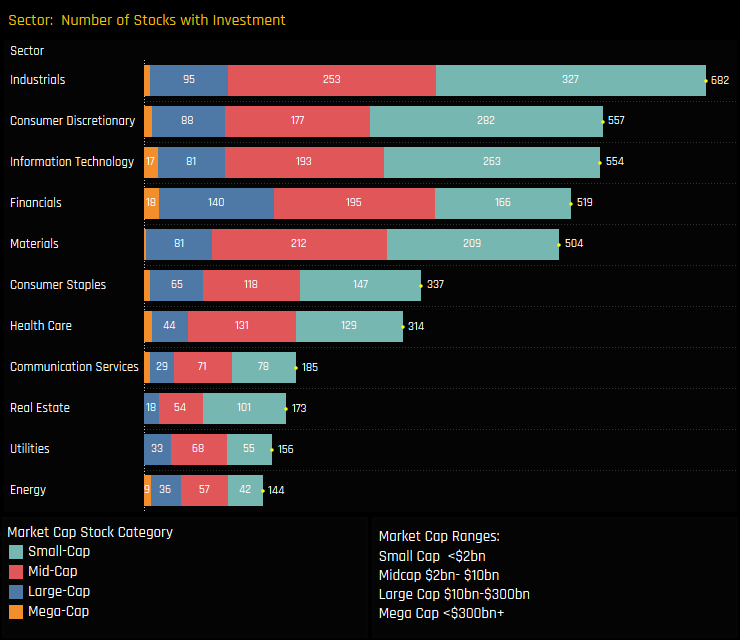
The chart opposite shows the number of companies that have found investment from the 372 active EM funds in our analysis, split by sector and the Market Cap of the stock. Industrials has more companies capturing investment than any other sector, with 682 stocks in total and 327 of those with a Market Cap of below $2bn.
When combined with the fact that Small/Midcap strategies are allocating substantially more to the Industrials sector than their Large Cap peers, it highlights the breadth of opportunity within the sector. Perhaps the next leg higher will be driven by the next generation of companies at the lower end of the market cap spectrum – there is certainly no lack of investible opportunities.
In the full analysis we delve in to the key Industrials stocks that make up the bulk of the allocations among active EM managers, and identify the companies that Small/Midcap managers are taking the largest positions in.
Time-Series & Stock Level Activity
Summary
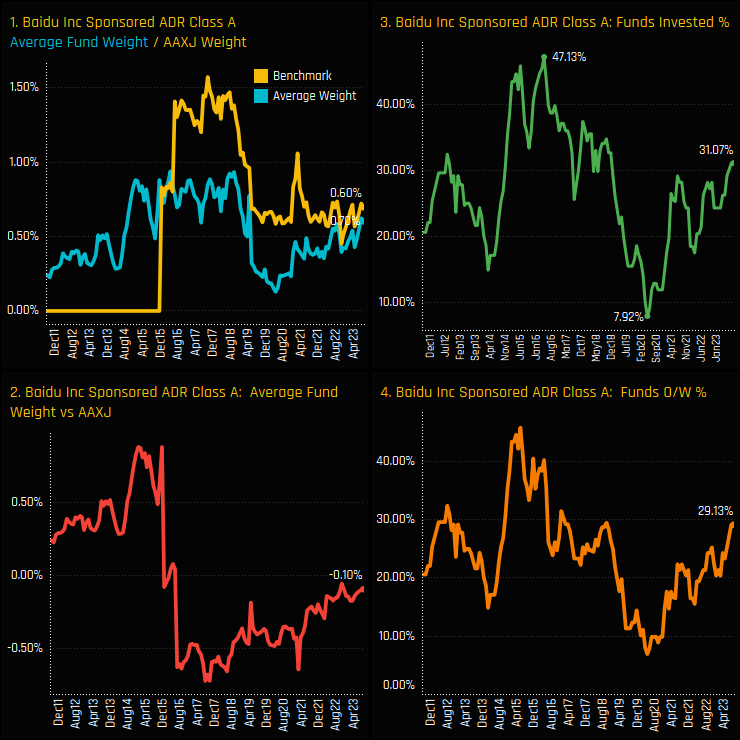
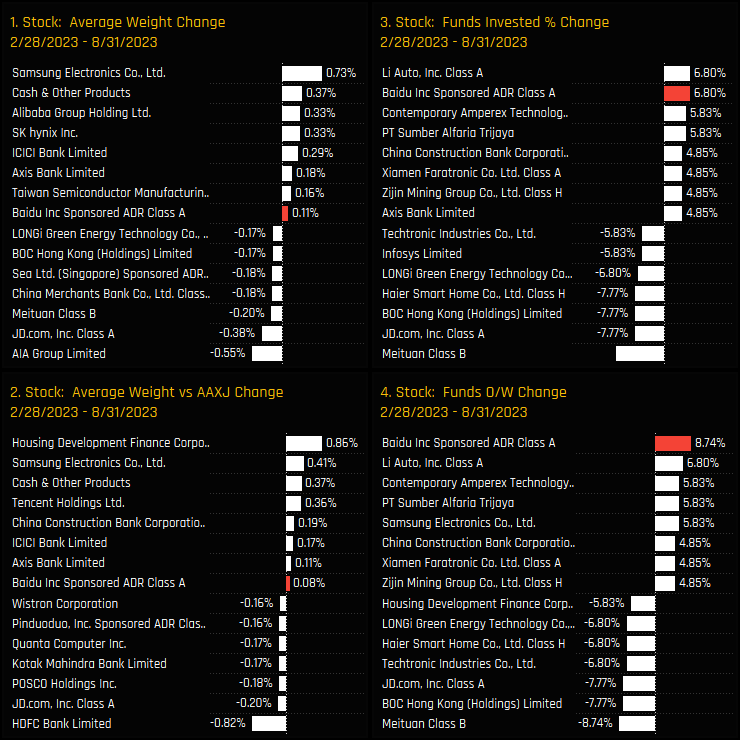
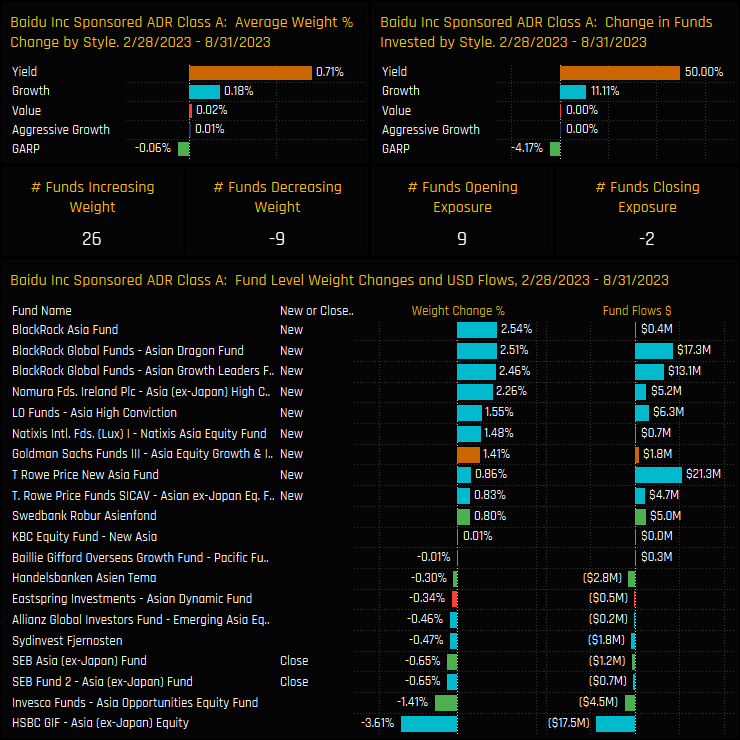
Drilling down to a fund level provides further details of this active rotation, as the chart to the right shows. All Style groups except GARP saw ownership levels rise, led predominantly by Growth funds and the small number of Yield funds in our analysis. Of the 103 funds we track, 26 increased weights in Baidu Inc. and 9 opened new positions compared to just 2 closing.
The fact that managers are re-engaging with the name after such a heavy period of selling between 2016 and 2020 confirms a marked turnaround in the investment case. In our full analysis, we find that Value funds are among the top investors, but a growing number of Growth funds are buying in to the story. As it stands though, we are a long way from peak ownership. A total of 86 Asia Ex-Japan funds have owned Baidu Inc. at some point over the last decade, but only 32 are currently invested. There is plenty of potential for ownership to move higher from here.
To request access to the full reports mentioned above or inquire about a subscription to our research, please e-mail me directly on the below:
Related Posts

- Steve Holden
- January 10, 2024
Riding High: The Magnificent 7 Surge in Global Equity Funds
The Magnificent 7, comprising Microsoft, Apple, Alphabet, Amazon, Meta, NVIDIA and T ..

- Steve Holden
- March 6, 2024
UK Real Estate Hots Up
270 UK Equity Funds, AUM $190bn UK Real Estate Hots Up • Record number of UK funds now expose ..

- Steve Holden
- December 19, 2023
Saudi Arabia Special Report: A Tipping Point in EM Equity Allocations
2023 marks a pivotal year with EM investors significantly increasing holdings in the Saudi mark ..

