Active Asia Ex-Japan Funds: Q3 2026 Performance & Attribution

Active Fund Intelligence · Asia ex-Japan Universe

Active Asia Ex-Japan Funds: Q3 2026 Performance & Attribution

Korean and Taiwanese semiconductors delivered more than the entire return, but cash and the Taiwan underweight left active Asia ex-Japan funds 0.75% behind the index

23 October 2026 · Steven Holden · Data to 30 September 2026

Overview

Small majority beat the index, but the average did not

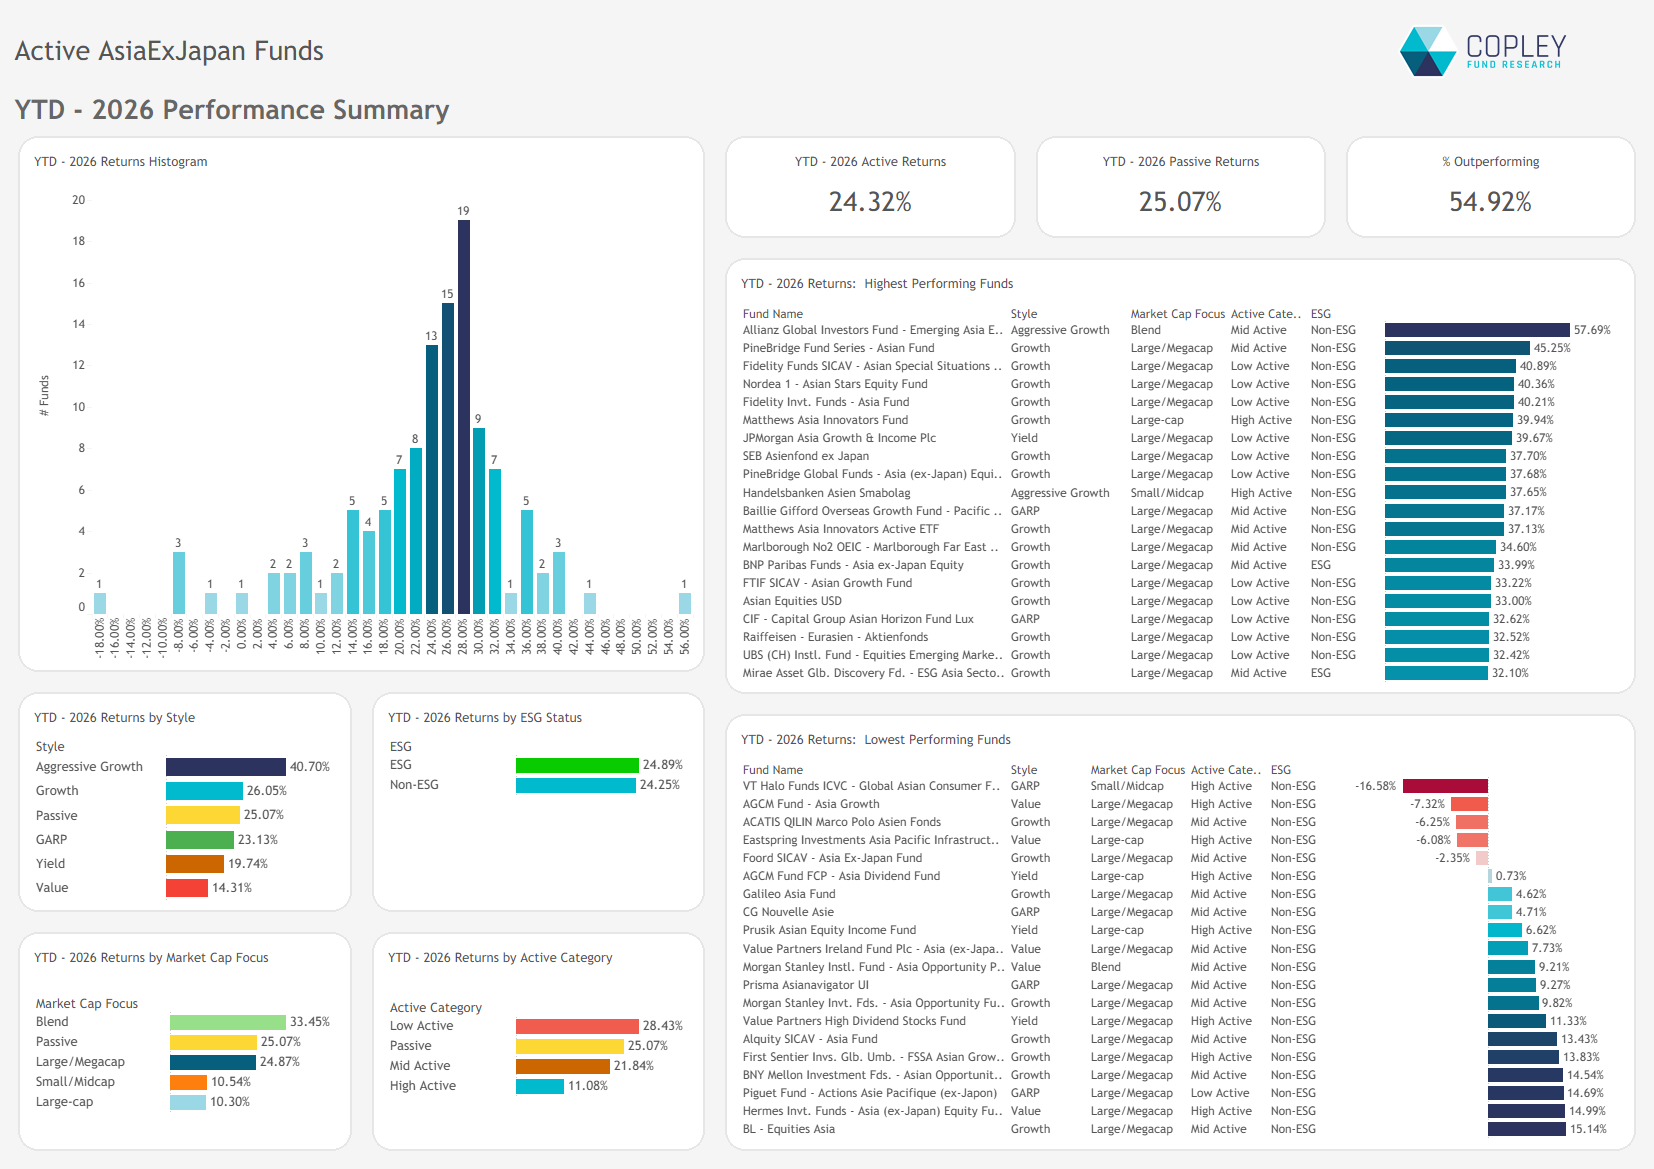
The average active Asia ex-Japan fund returned 24.32% in the first nine months of 2026, against 25.07% for the iShares MSCI All Country Asia ex-Japan ETF (AAXJ), an average alpha of -0.75%. The headline understates how many managers did well: 54.92% of funds beat the index, and the median fund return of 26.6% was ahead of it. A small number of weak funds pulled the average below the benchmark.

This note breaks down the returns of 159 active Asia ex-Japan funds. It shows where managers won and lost against the benchmark, and which fund types came out ahead. Headline returns are based on actual fund returns; the contribution and attribution figures are estimated from each fund’s monthly holdings filings, so the two are close but will not match exactly.

01 · Return contribution
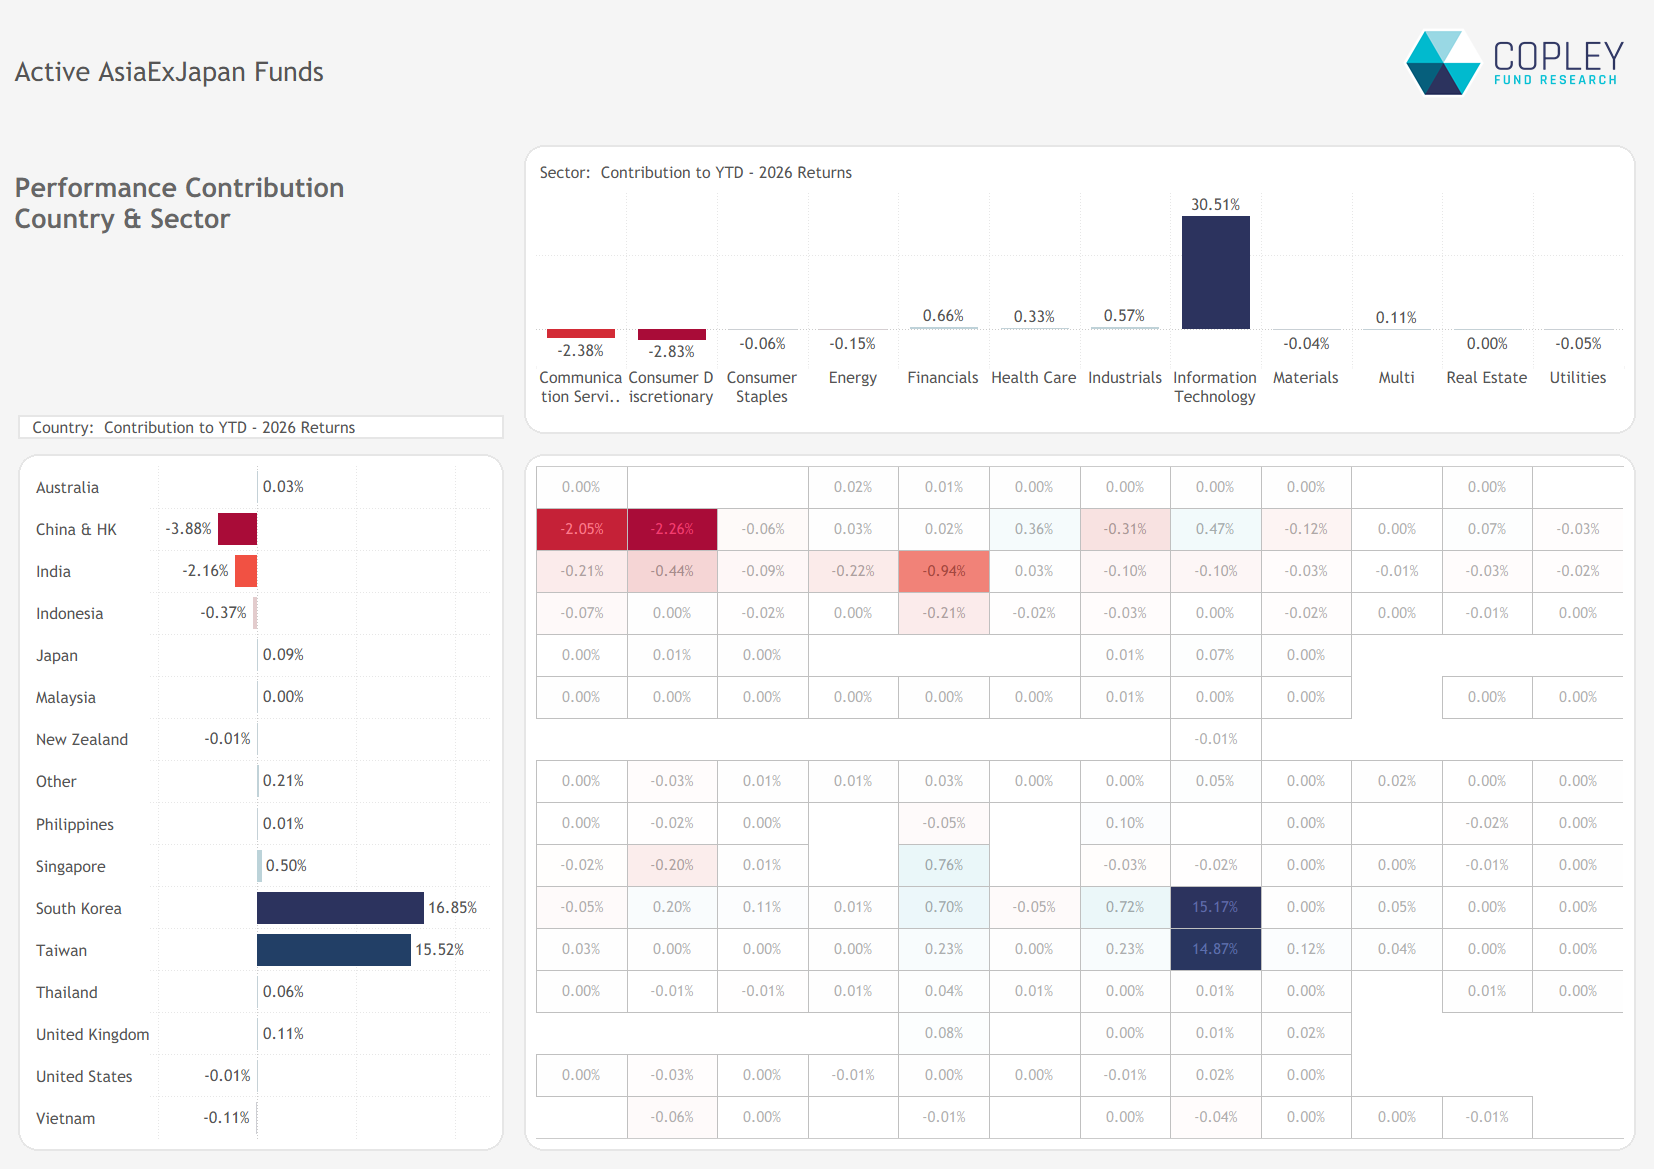
Chart 1

Korea and Taiwan delivered more than the entire return

South Korea added 16.85% to the average fund return and Taiwan 15.52%. Together these two markets added 32.37%, more than the average fund’s entire return. China & HK (-3.88%) and India (-2.16%) were the biggest detractors, followed by Indonesia (-0.37%). Singapore (+0.50%) was the strongest of the remaining markets.

The sector view tells the same story, with IT contributing 30.51% to total returns. Almost all of that came from two country/sector pairs: Korean IT (+15.17%) and Taiwanese IT (+14.87%). Strip Technology out and the average Asia ex-Japan fund is down on the year. Consumer Discretionary (-2.83%) and Communication Services (-2.38%) were the largest sector detractors, almost entirely from China.

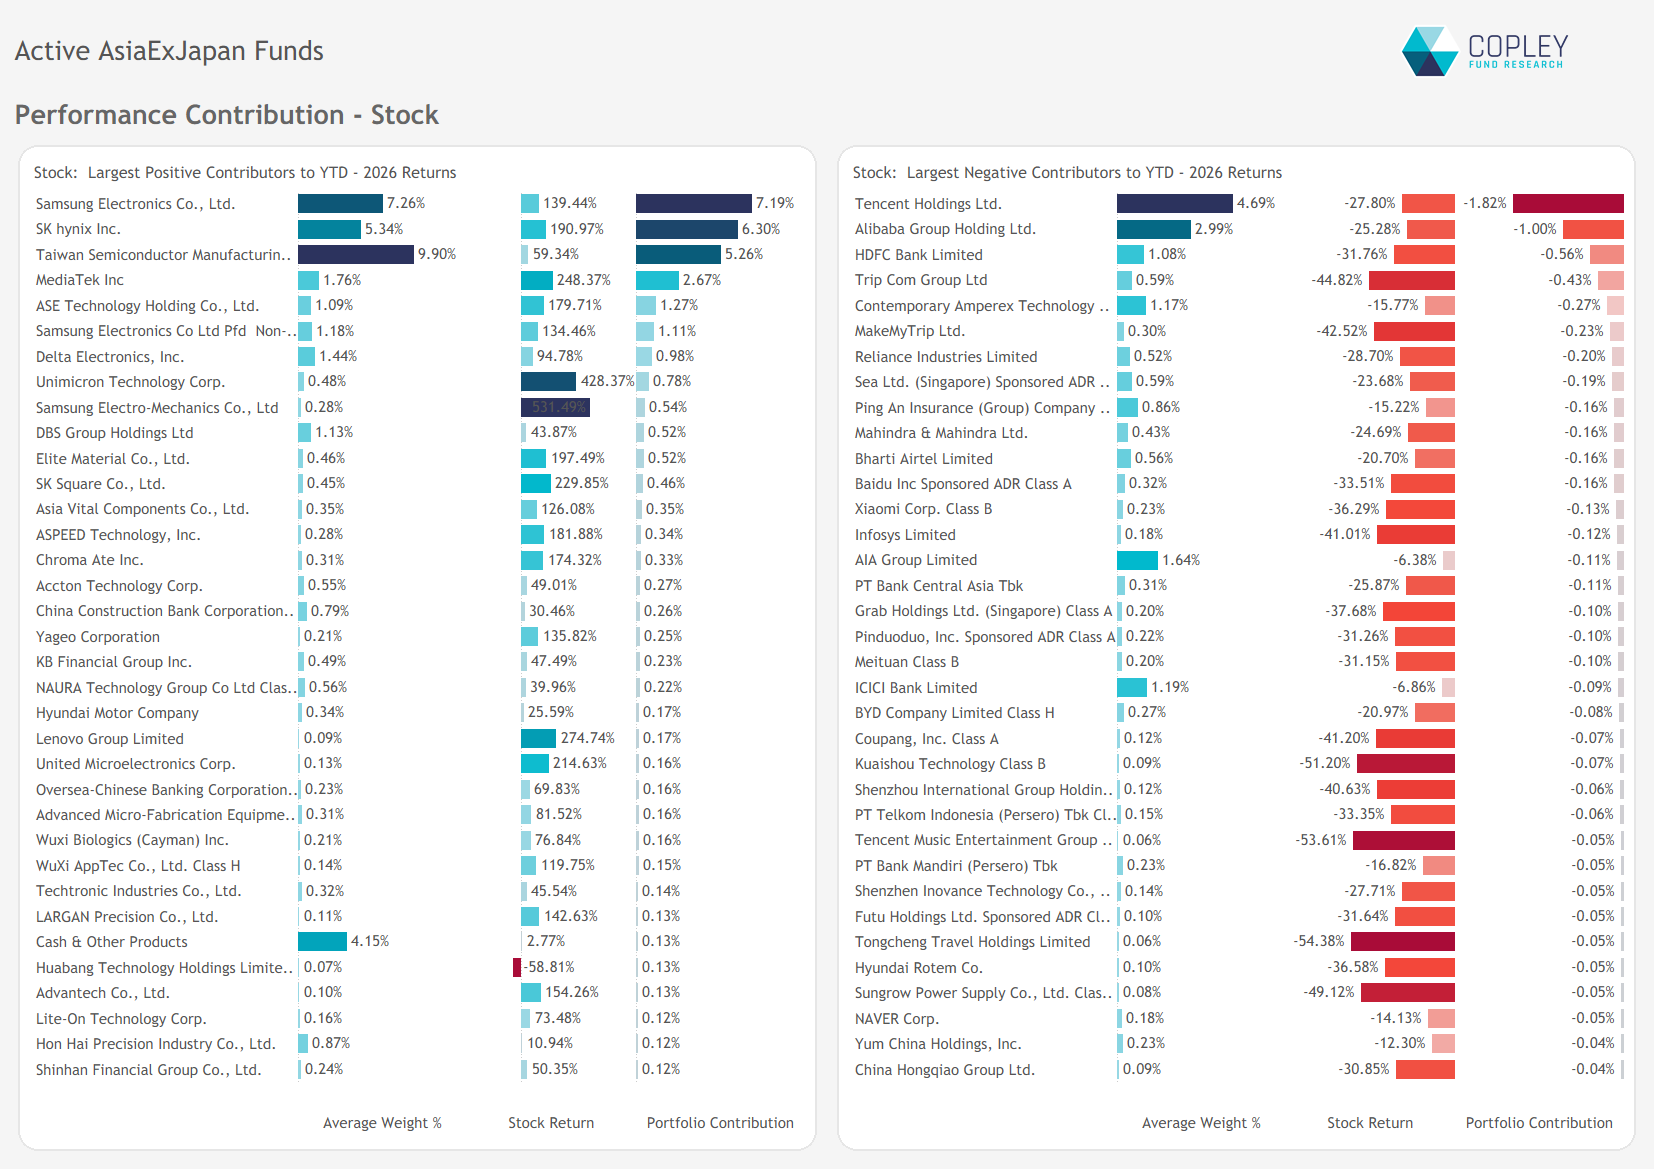
Chart 2

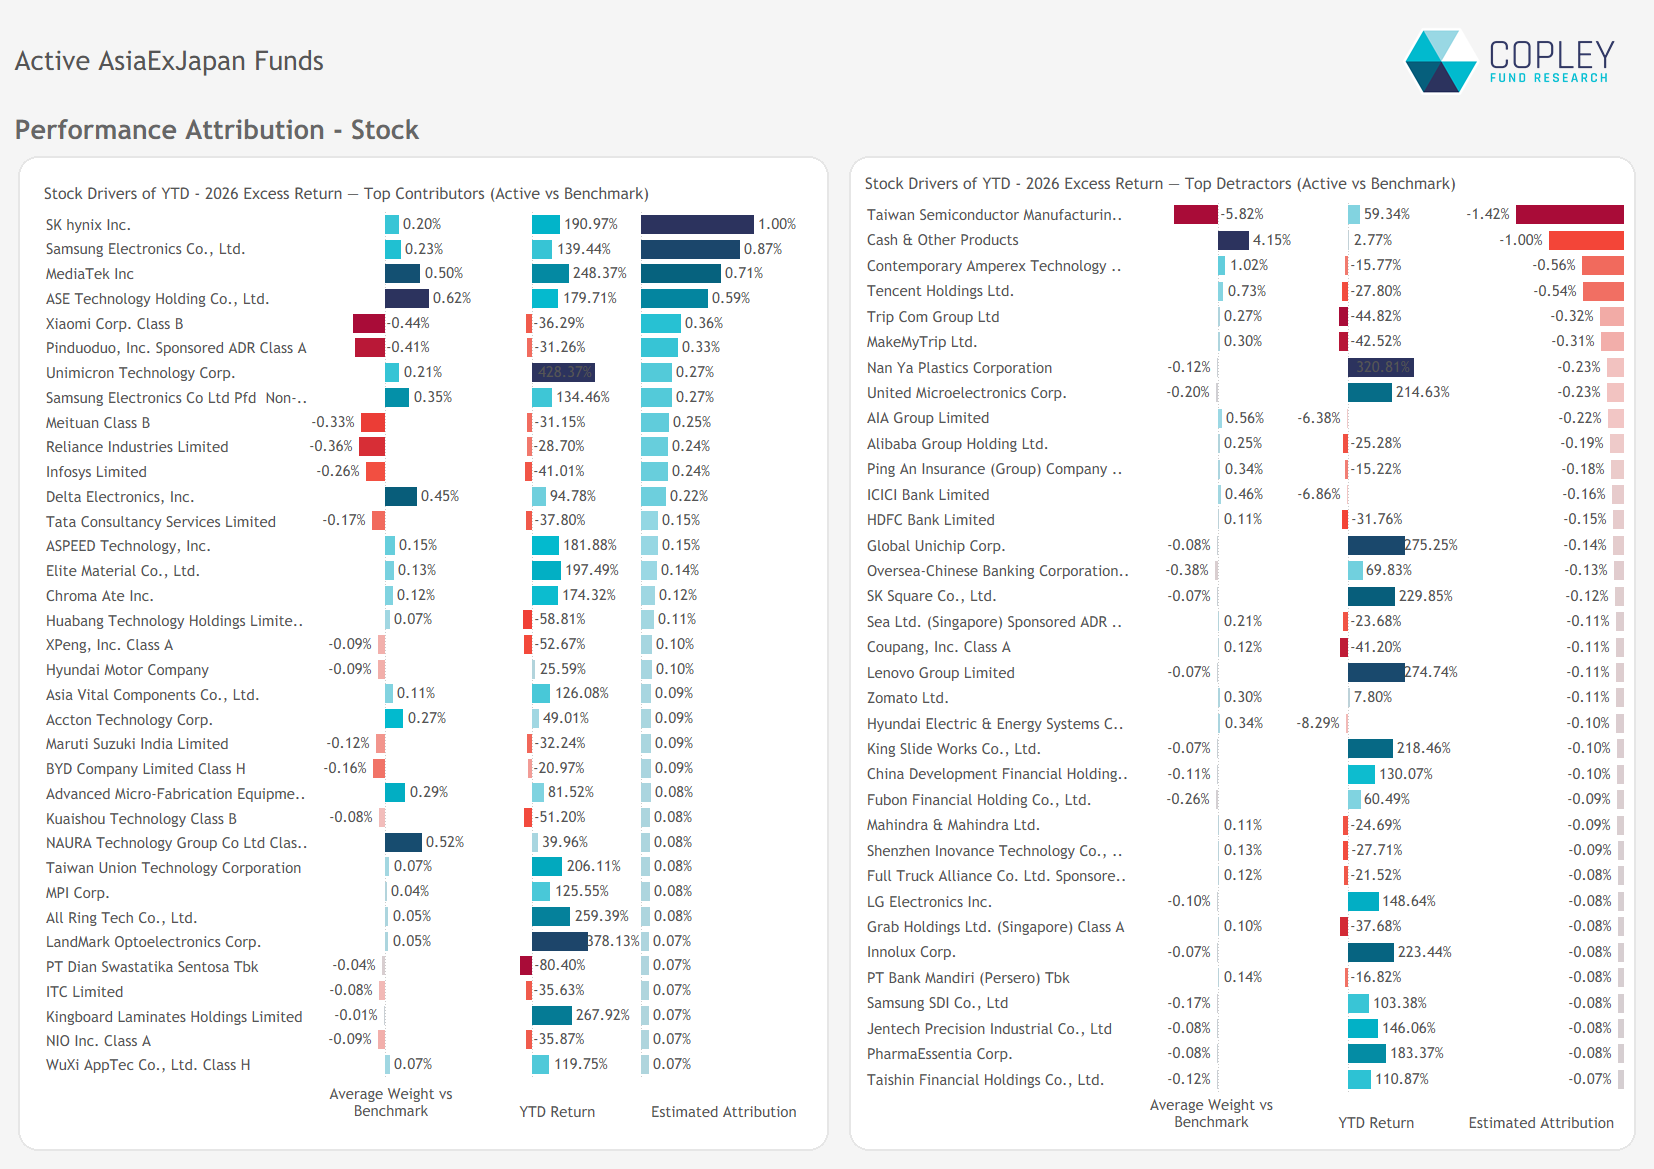
Three semiconductor stocks did three-quarters of the work

Samsung Electronics (+7.19%), SK hynix (+6.30%) and TSMC (+5.26%) added 18.75% between them, roughly three-quarters of the average fund’s return. MediaTek added a further 2.67% after rising 248%. Further down the list, Samsung Electro-Mechanics (+531%) and Unimicron (+428%) recorded exceptional gains from small average weights.

The largest detractors were widely held names that have long featured in Asian portfolios: Tencent (-1.82%), Alibaba (-1.00%), HDFC Bank (-0.56%), Trip.com (-0.43%) and CATL (-0.27%). MakeMyTrip, Reliance Industries, Sea and Ping An also featured among the detractors.

02 · Attribution vs benchmark
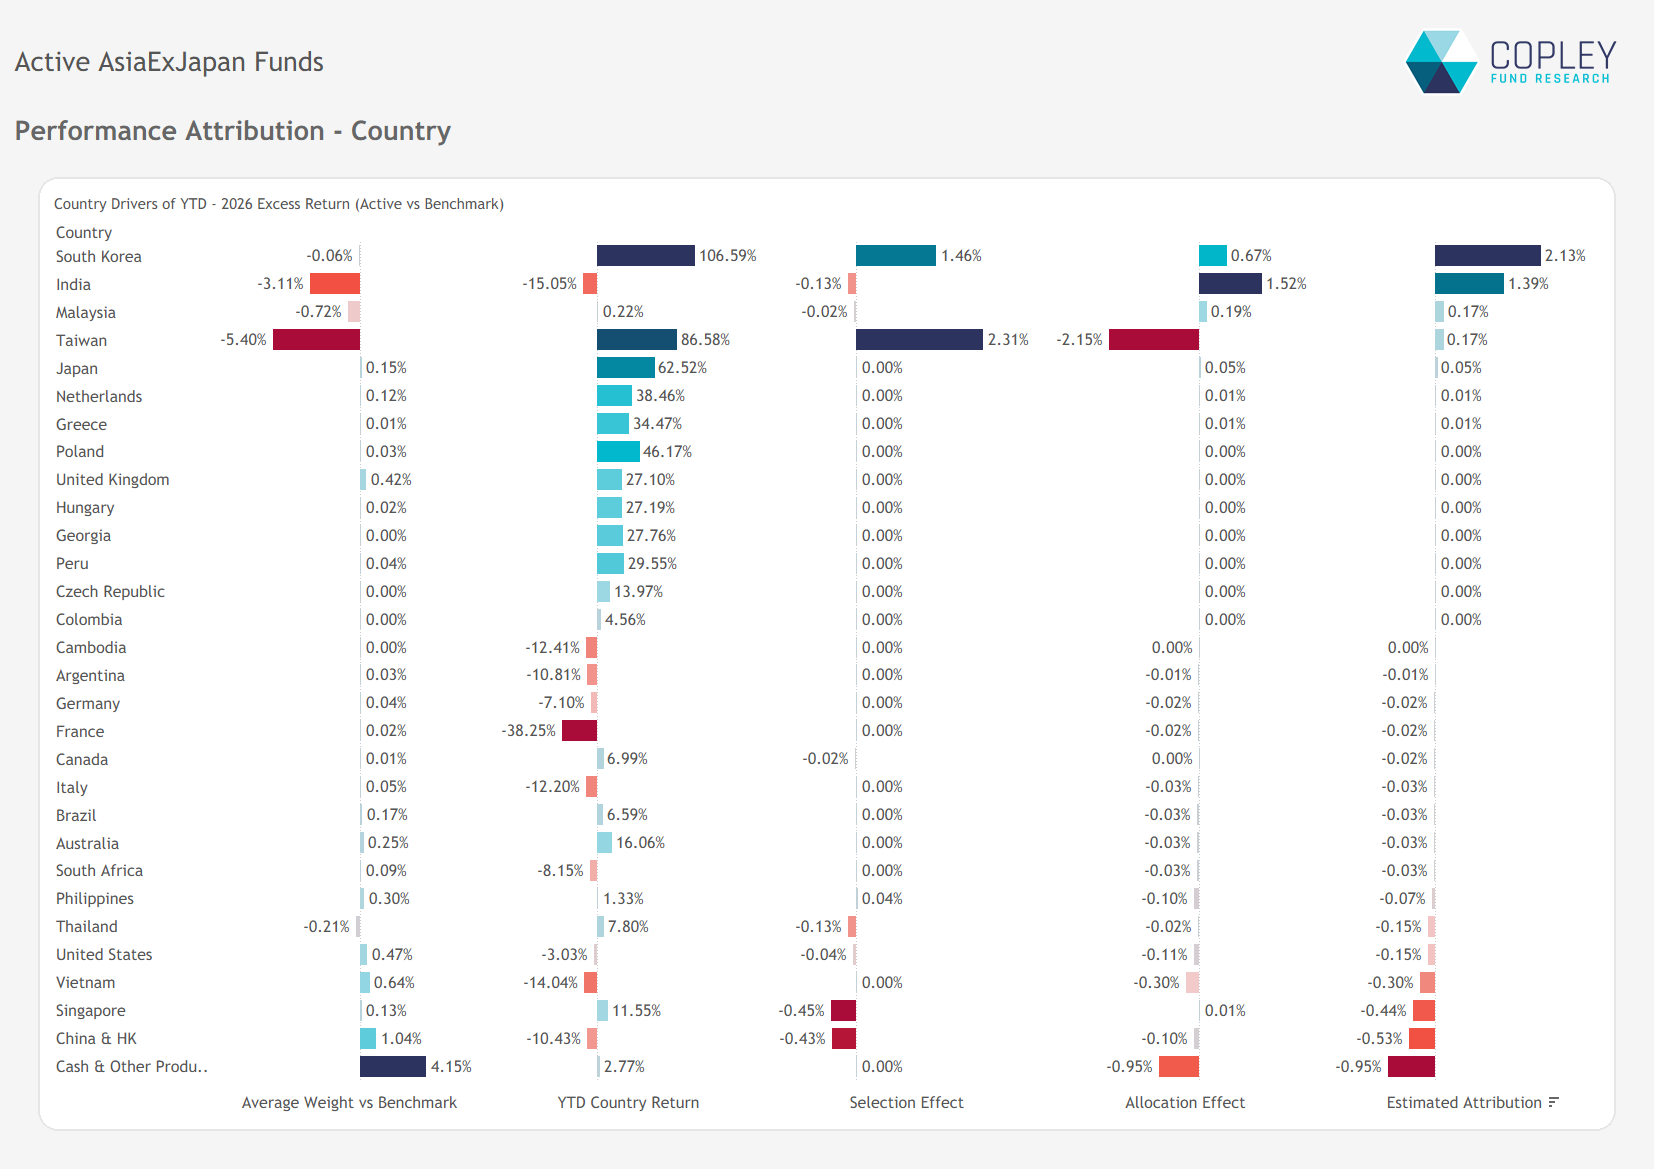
Chart 3

Korea and India added value; the Taiwan underweight and cash cost the most

The -0.75% shortfall was the net result of sizeable gains and losses that largely offset one another.

Positive contributors:

  • South Korea. Stock selection added 1.46% and allocation 0.67% in a market that rose 106.59%, a net +2.13%.
  • India. The 3.11% underweight in a market that fell 15.05% added 1.39%, mainly through allocation.
  • Taiwan. The 5.40% underweight in a market that rose 86.58% cost 2.15% in allocation, but stock selection added 2.31%, for a net +0.17%.

Negative contributors:

  • Cash. An average weight of 4.15% cost 0.95%, more on its own than the reported 0.75% shortfall.
  • China & HK. The 1.04% overweight cost 0.53%, mainly through stock selection.
  • Singapore. Stock selection cost 0.45%, for a net -0.44%.
  • Vietnam. The 0.64% overweight in a market that fell 14.04% cost 0.30%.
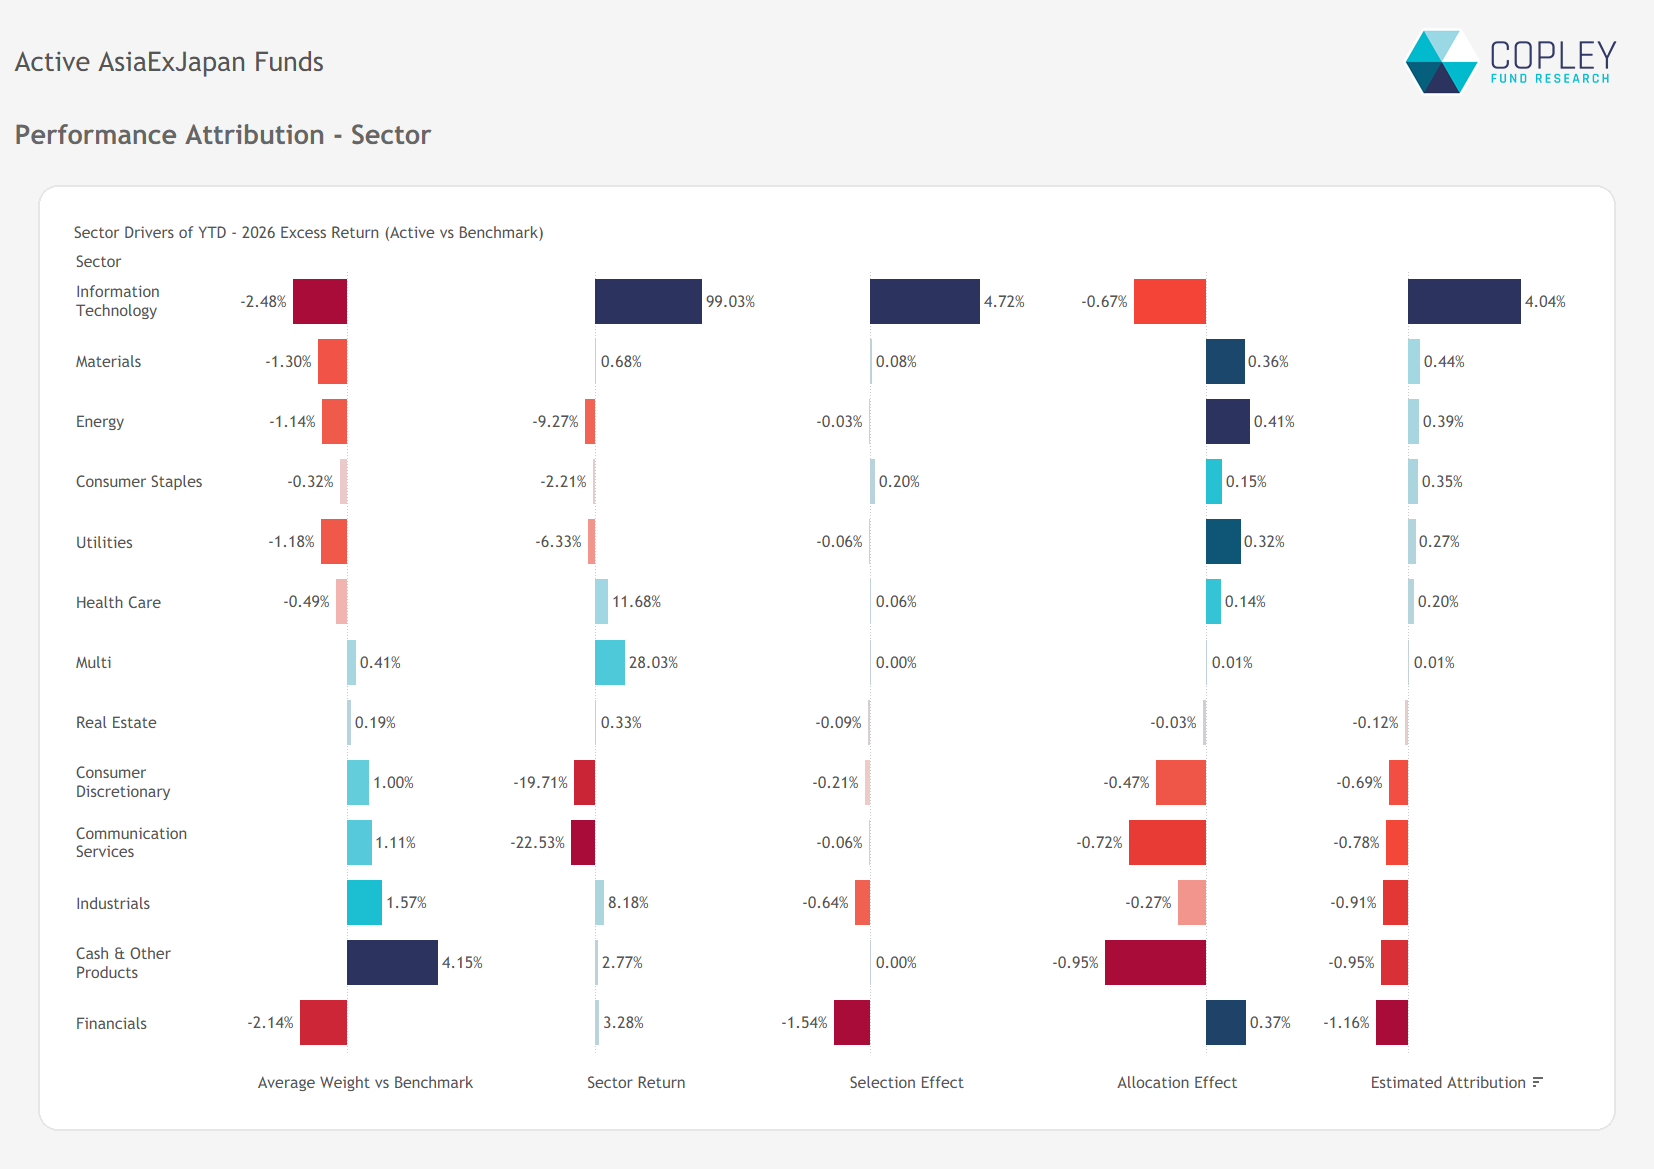
Chart 4

IT: stock selection more than offset the underweight

The 2.48% underweight in IT, a sector that returned 99%, cost 0.67% in allocation. Stock selection added 4.72%, for a net +4.04%. Korean IT accounted for +2.09%, Chinese IT +0.82% and Taiwanese IT +0.70%. Underweights in Materials (+0.44%), Energy (+0.39%) and Consumer Staples (+0.35%) also added value.

Financials (-1.16%, mainly stock selection) was the largest detractor. Industrials (-0.91%), Communication Services (-0.78%) and Consumer Discretionary (-0.69%) followed. These were the three largest sector overweights (+1.57%, +1.11% and +1.00%), and the latter two returned -22.53% and -19.71% respectively. At the country/sector level, the 2.24% overweight in China Industrials was the largest single cost (-1.03%).

Chart 5

Overweights in Korean chip names added value; the TSMC underweight cost the most

Positive stock attribution came from two sources. Overweights in SK hynix (+1.00%), Samsung Electronics (+0.87%), MediaTek (+0.71%) and ASE Technology (+0.59%) added value, as did underweights in Xiaomi (+0.36%), PDD (+0.33%), Meituan (+0.25%), Reliance Industries and Infosys (+0.24% each).

The largest detractor was TSMC (-1.42%), where the average fund was 5.82% underweight a stock that rose 59%. Overweights in CATL (-0.56%), Tencent (-0.54%), Trip.com (-0.32%) and MakeMyTrip (-0.31%) also detracted, as did small underweights in Nan Ya Plastics and United Microelectronics (-0.23% each), which rose 321% and 215% respectively.

03 · Fund return summary
Chart 6

Lower active share funds performed best

With returns concentrated in a small number of semiconductor stocks, funds positioned closer to the index performed best. Low-active and Growth funds both finished ahead of the index return of 25.07%.

  1. Active share: low-active funds returned 28.43%, against 11.08% for high-active funds.
  2. Style: Growth funds returned 26.05% and GARP funds 23.13%. Value funds returned 14.31%.
  3. Market cap: Large/Megacap funds returned 24.87%. Small/Midcap funds returned 10.54%.
 

Dispersion remained wide. Allianz Global Investors Fund – Emerging Asia Equity returned 57.69% and PineBridge Asian Fund 45.25%, while VT Halo Global Asian Consumer returned -16.58%. Five of the 159 funds lost money.

Extended Report

Asia ex-Japan Performance & Attribution Pack: Q3 2026

The full pack behind this piece covers performance, country, sector and stock attribution for the average active Asia ex-Japan fund. It also includes 1, 3, 5 and 10-year peer rankings.

Leave A Comment

Terms and Conditions

By purchasing an Investor Positioning Report, you agree to our full Terms and Conditions.

View Terms and Conditions →