Active Global Funds: Q3 2026 Performance & Attribution
Semiconductors drove most of the returns, but underweights in the sector have left active Global funds 4.10% behind the index
22 October 2026 · Steven Holden · Data to 30 September 2026
Overview
Another year behind the benchmark
The average active Global fund returned 8.32% in the first nine months of 2026, against 12.43% for the SPDR MSCI ACWI ETF. Only 26% of funds beat the index, with average alpha at -4.10%.
If that holds, 2026 will be the third year in a row of a shortfall of 4% or more, after -5.59% in 2024 and -4.14% in 2025. This note breaks down the returns of 371 active Global funds ($1.66tr AUM). It shows where managers won and lost against the benchmark, and which fund types came out ahead.
01 · Return contribution
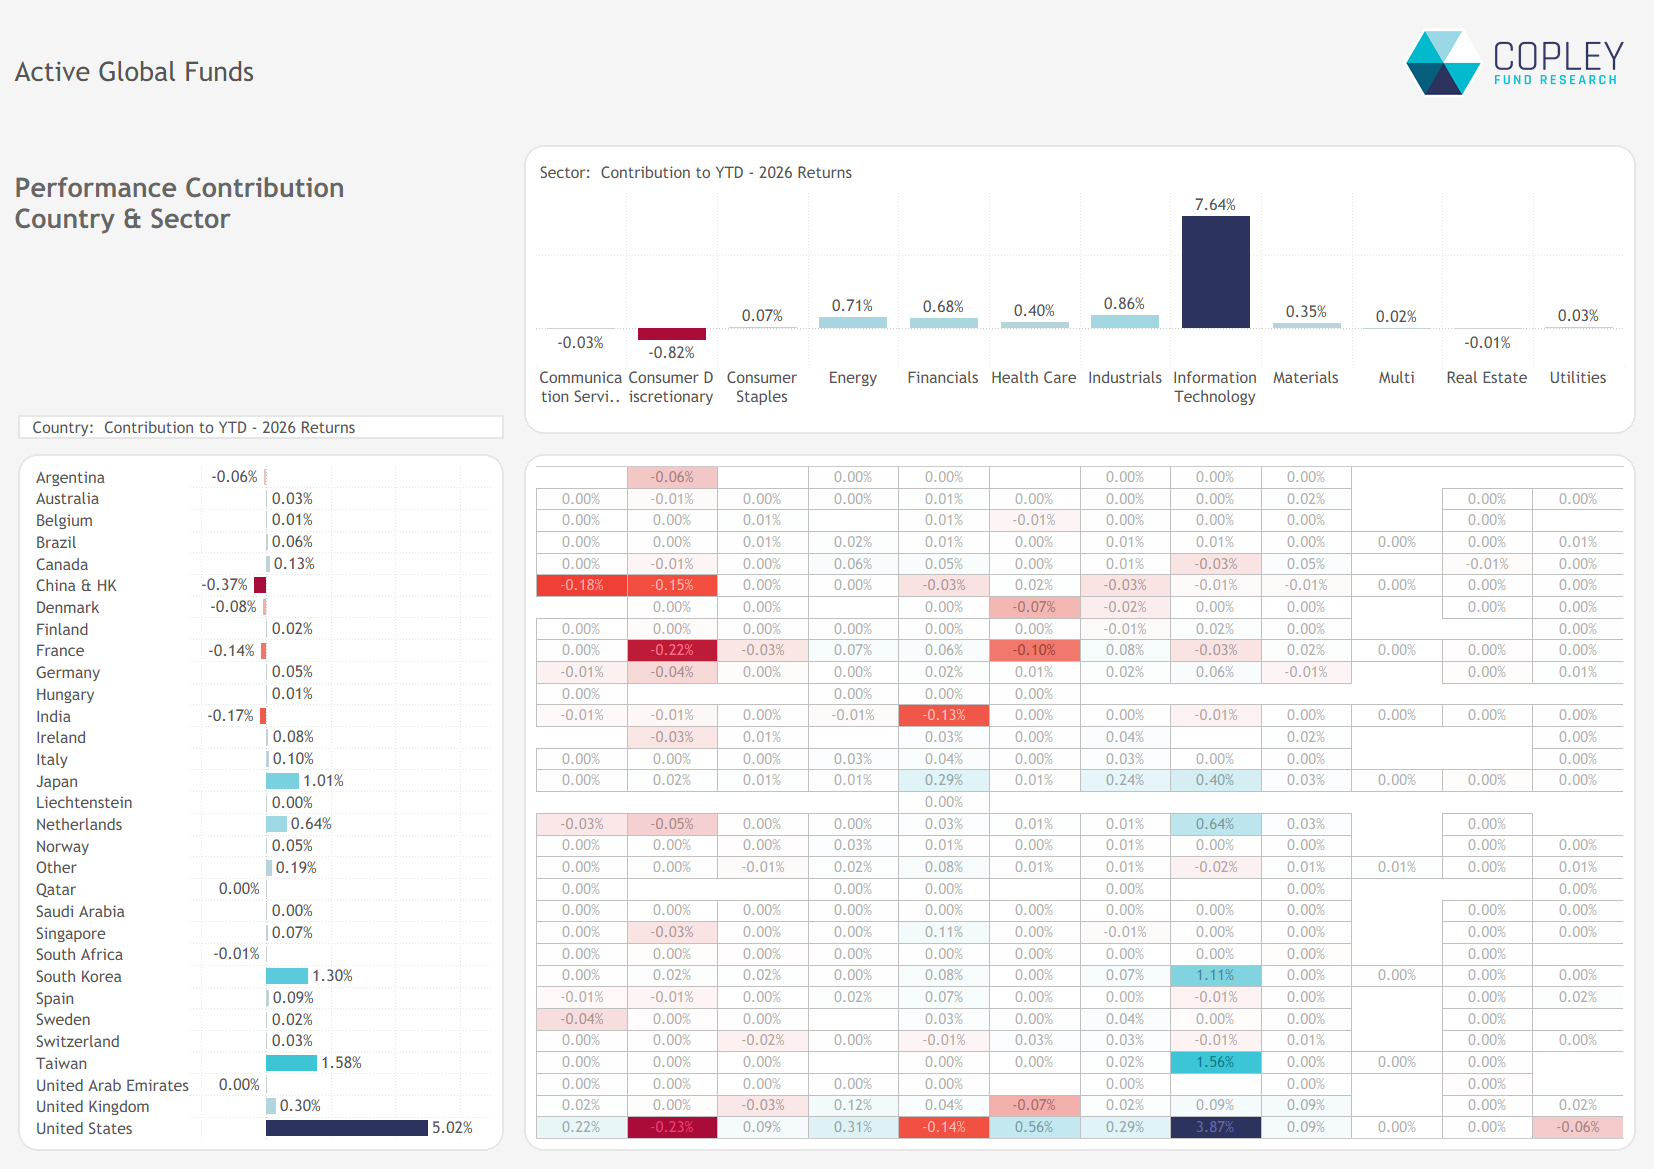
Chart 1
US and Asian tech delivered more than the entire collective return
The US added 5.02% to the average fund return, 60% of the total. Taiwan (+1.58%), South Korea (+1.30%) and Japan (+1.01%) added another 3.89%. Together these four markets added more than the fund’s entire return. China & HK (-0.37%), India (-0.17%) and France (-0.14%) were the biggest detractors.
The sector view is more concentrated still, with IT contributing 7.64% to total returns. Again, most of that came from four country/sector pairs: US IT (+3.87%), Taiwanese IT (+1.56%), Korean IT (+1.11%) and Dutch IT (+0.64%). Strip Technology out and the average Global fund is up just 0.68% on the year. Consumer Discretionary (-0.82%) was the only sizeable sector detractor.
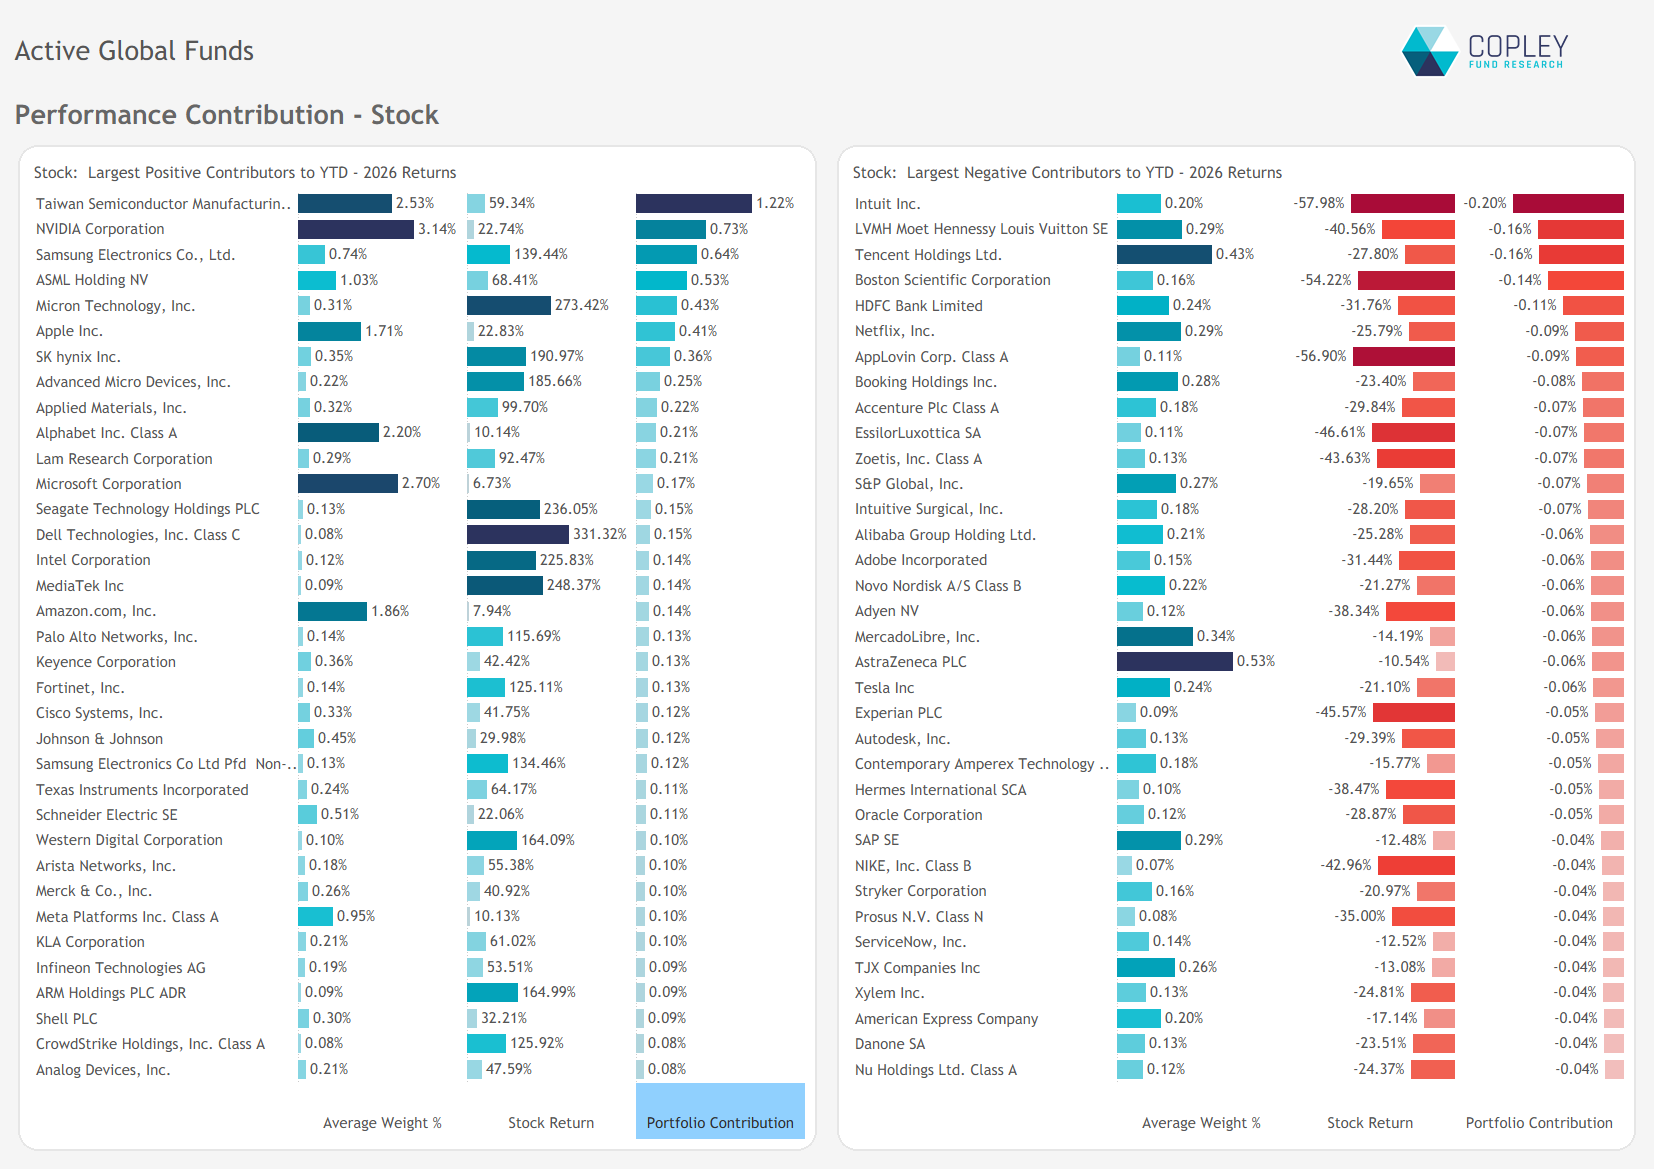
Chart 2
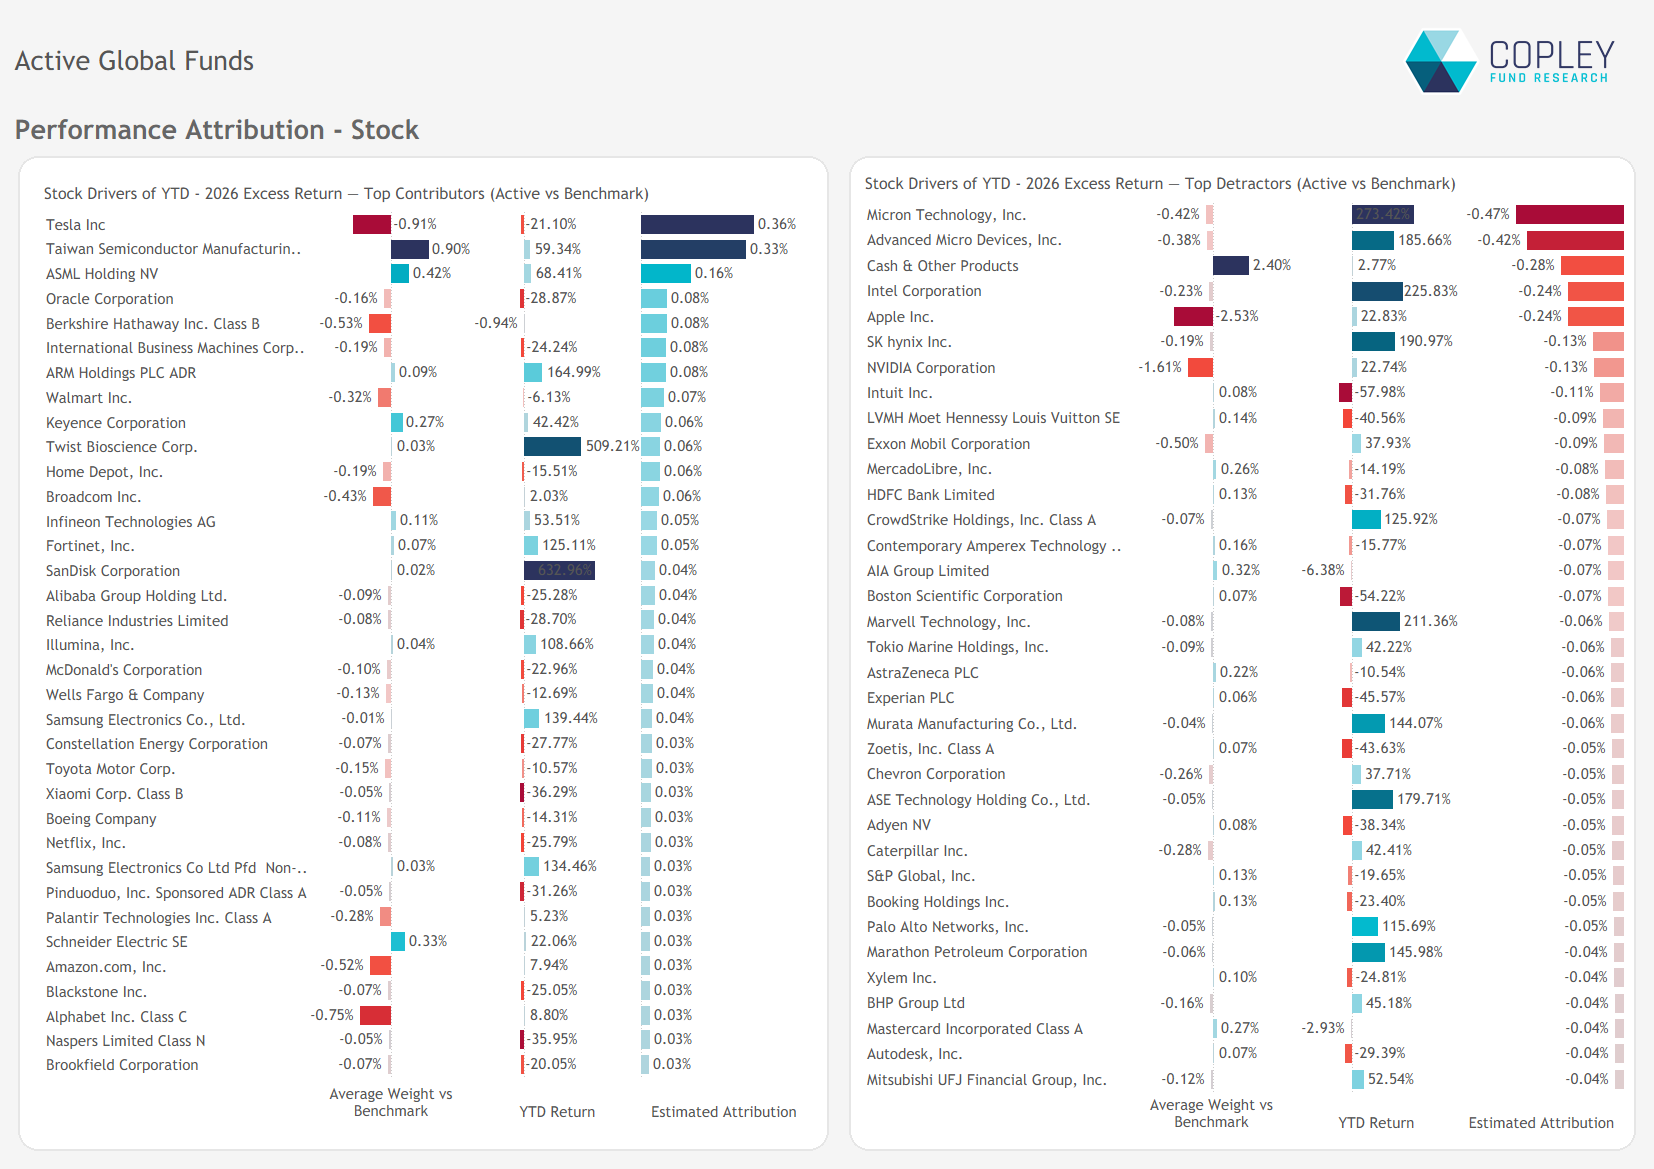
Five Semiconductor stocks did over 40% of the work
TSMC (+1.22%), NVIDIA (+0.73%), Samsung Electronics (+0.64%), ASML (+0.53%) and Micron (+0.43%) added 3.55% between them – that’s 43% of the average fund’s return. Micron got there from just a 0.31% average weight after rising a remarkable 273%.
The largest detractors were quality and software names widely held in Global portfolios: Intuit (-0.20%), LVMH (-0.16%), Tencent (-0.16%), Boston Scientific (-0.14%) and HDFC Bank (-0.11%). Adobe, Accenture, Autodesk, Oracle, SAP and ServiceNow also featured among the detractors.
02 · Attribution vs benchmark
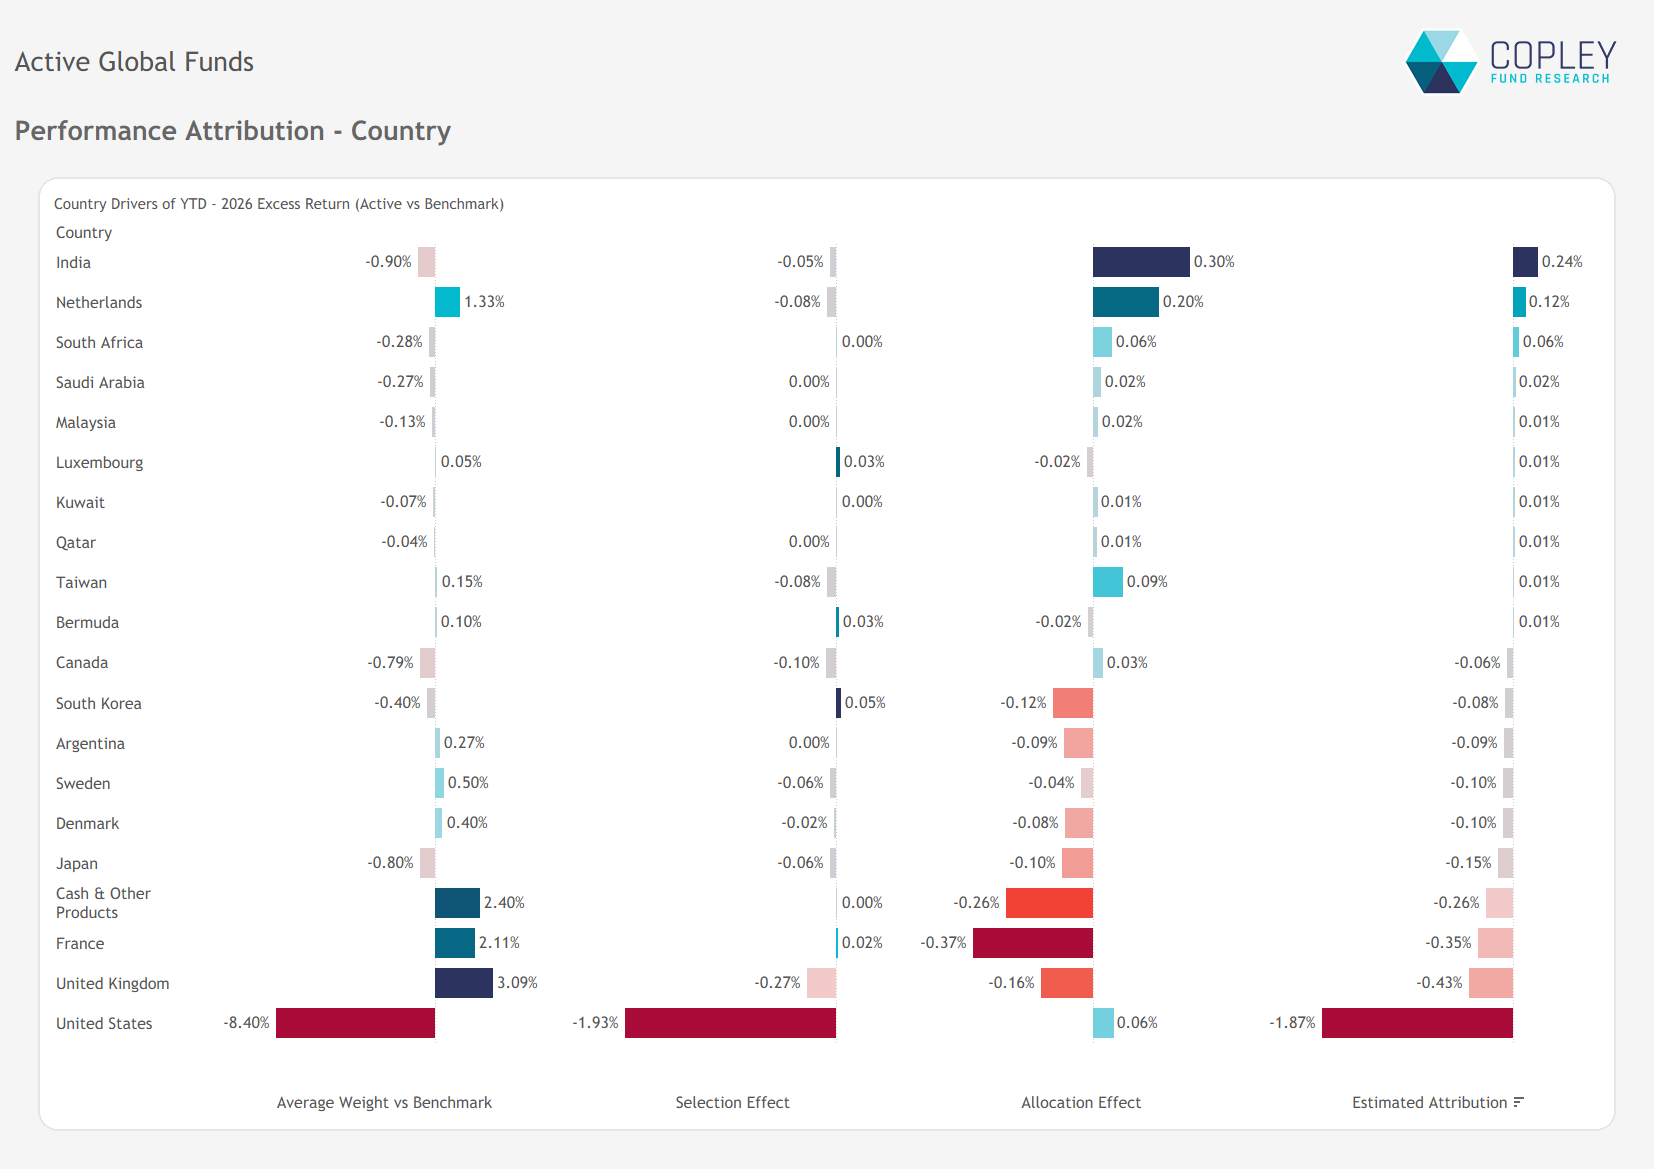
Chart 3
US stock selection was the largest source of underperformance
The underperformance came from a broad range of country positions, with few contributing positively.
Positive contributors: the underweight in India (+0.24%, mainly allocation) and the overweight in the Netherlands (+0.12%). These were the only countries contributing more than 0.10%.
Negative contributors:
United States. The 8.40% underweight had little effect (+0.06% allocation). Stock selection cost 1.93%, for a net -1.87%.
United Kingdom. The largest overweight (+3.09%) cost 0.43%.
France. The 2.11% overweight cost 0.35%, mainly through allocation.
Cash. An average weight of 2.40% cost 0.26%.
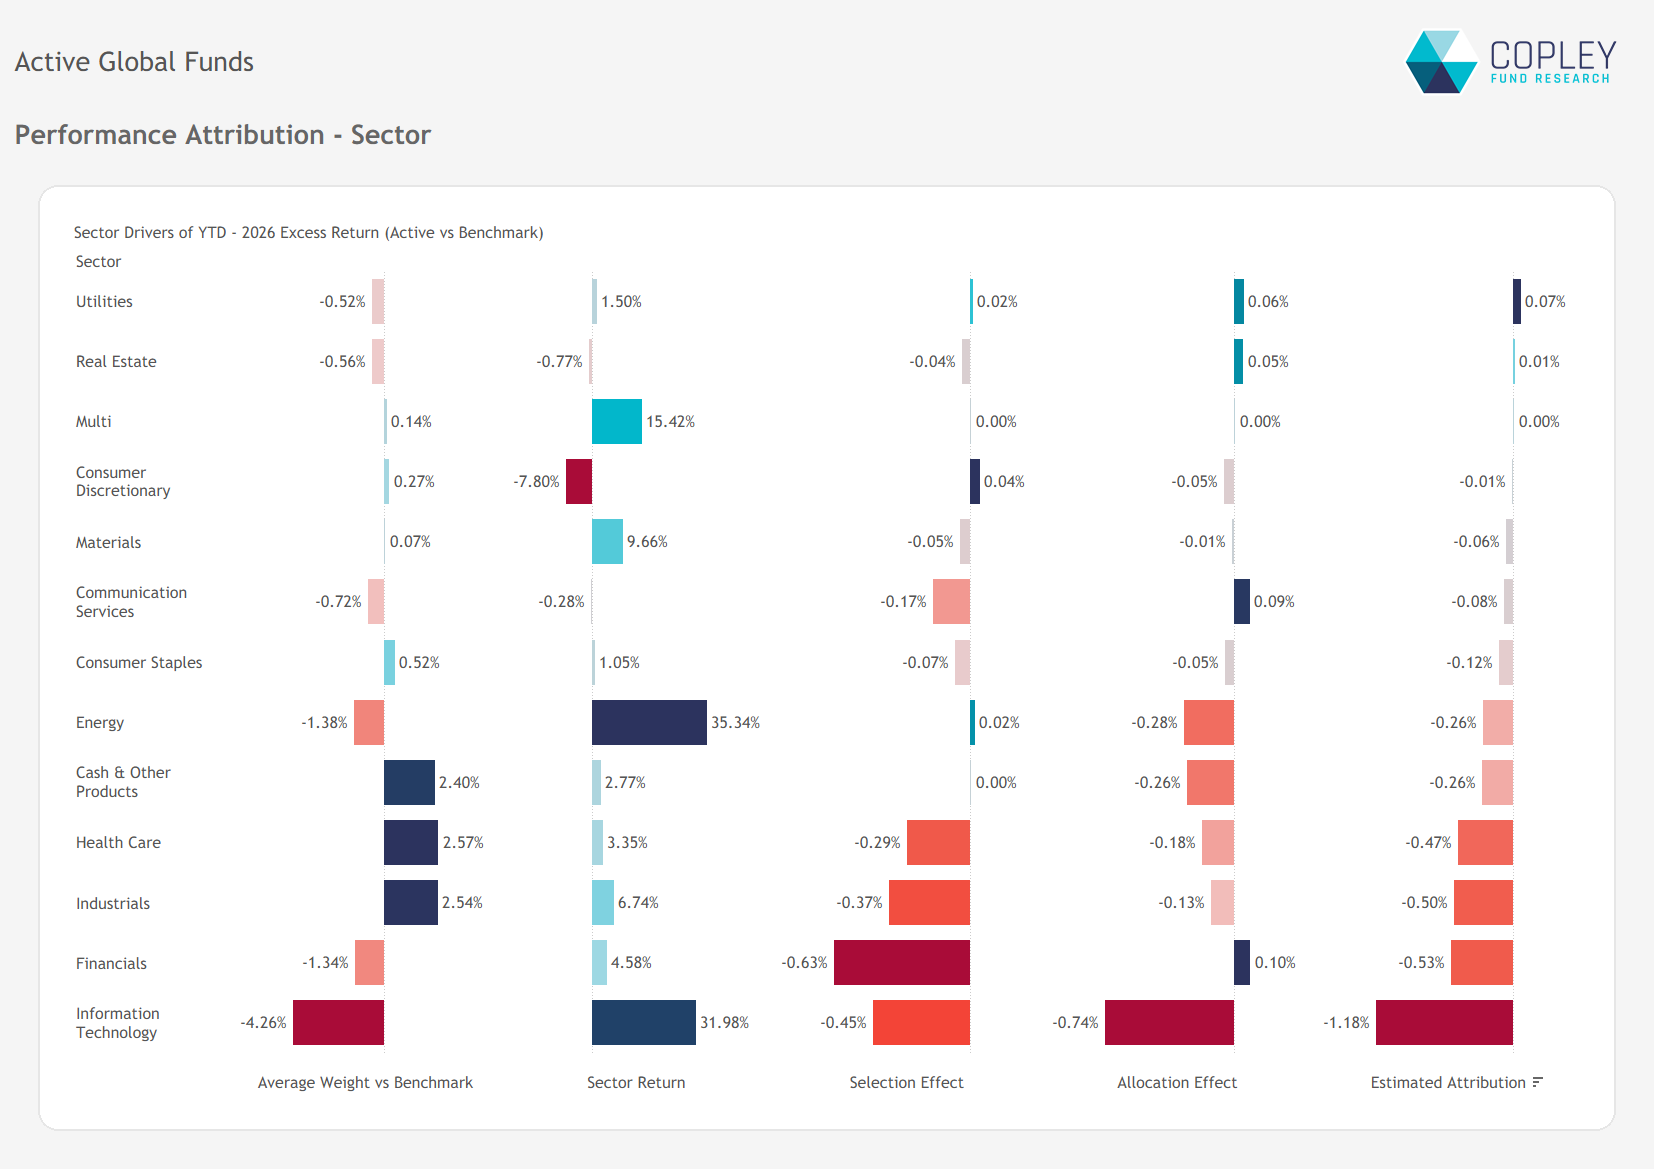
Chart 4
IT: allocation and selection both detracted
Among GEM managers, stock selection in IT offset the cost of the underweight. In Global funds, both effects were negative. The 4.26% underweight in a sector that returned 32% cost 0.74% in allocation, and stock selection cost a further 0.45%, a net -1.18%. US IT accounted for -1.53%.
Financials (-0.53%, mainly stock selection), Industrials (-0.50%) and Health Care (-0.47%) were the next largest detractors. Industrials and Health Care were the largest sector overweights (+2.54% and +2.57%) but returned 6.74% and 3.35% respectively. The 1.38% underweight in Energy, which returned 35%, cost 0.26%. Only Utilities and Real Estate provided modest respite.
Chart 5
Overweights in semiconductor leaders added value; underweights in the wider sector cost more
Positive stock attribution came from two sources. Underweights in Tesla (+0.36%), Oracle, IBM and Berkshire Hathaway (+0.08% each) added value, as did overweights in TSMC (+0.33%), ASML (+0.16%) and ARM (+0.08%).
The largest detractors were Micron (-0.47%), AMD (-0.42%), Intel (-0.24%) and SK hynix (-0.13%), a combined -1.26%. Underweights in each were small, but all four rose by more than 180%. Larger underweights in Apple (-0.24%) and NVIDIA (-0.13%) also detracted, as did overweights in Intuit (-0.11%) and LVMH (-0.09%).
03 · Fund return summary
Chart 6
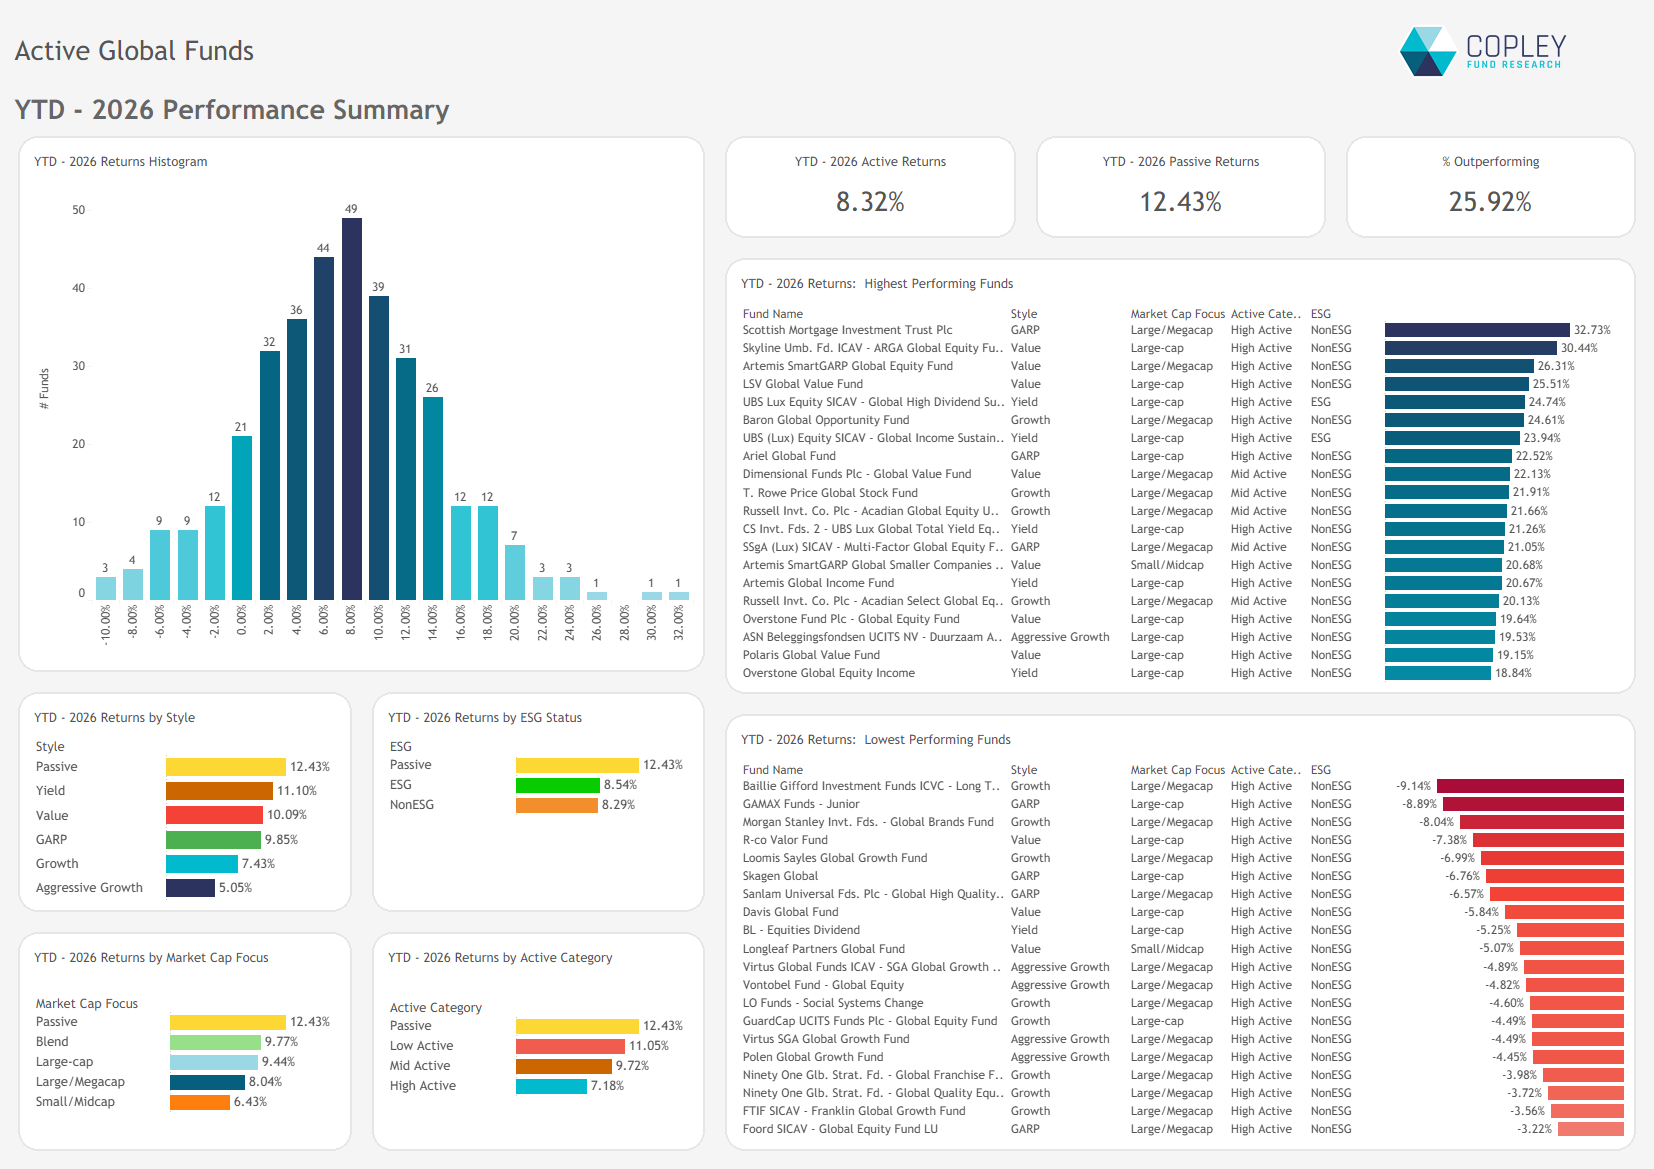
Lower active share funds performed best, but none matched the index
With returns concentrated in a small number of semiconductor stocks, funds positioned closer to the index performed best, although no fund category matched the index return of 12.43%.
Active share: low-active funds returned 11.05%, against 7.18% for high-active funds.
Style: Yield funds returned 11.10% and Value funds 10.09%. Aggressive Growth funds returned 5.05%.
Market cap: Blend funds returned 9.77% and Large/Megacap funds 8.04%. Small/Midcap funds returned 6.43%.
Dispersion remained wide. Scottish Mortgage Investment Trust returned 32.73% and ARGA Global Equity 30.44%, while Baillie Gifford Long Term Global Growth returned -9.14%. 12 of the bottom 20 funds were Growth or Aggressive Growth funds.
Extended Report
Global Performance & Attribution Pack: Q3 2026
The full pack behind this piece covers performance, country, sector and stock attribution for the average active Global fund. It also includes 1, 3, 5 and 10-year peer rankings.