Active GEM Funds: Q3 2026 Performance & Attribution

Active Fund Intelligence · GEM Universe

Active GEM Funds: Q3 2026 Performance & Attribution

Two markets, one sector and three stocks did nearly all the work for active GEM funds this year

22 October 2026 · Steven Holden · Data to 30 September 2026

Overview

Active GEM funds kept pace, but returns were narrow

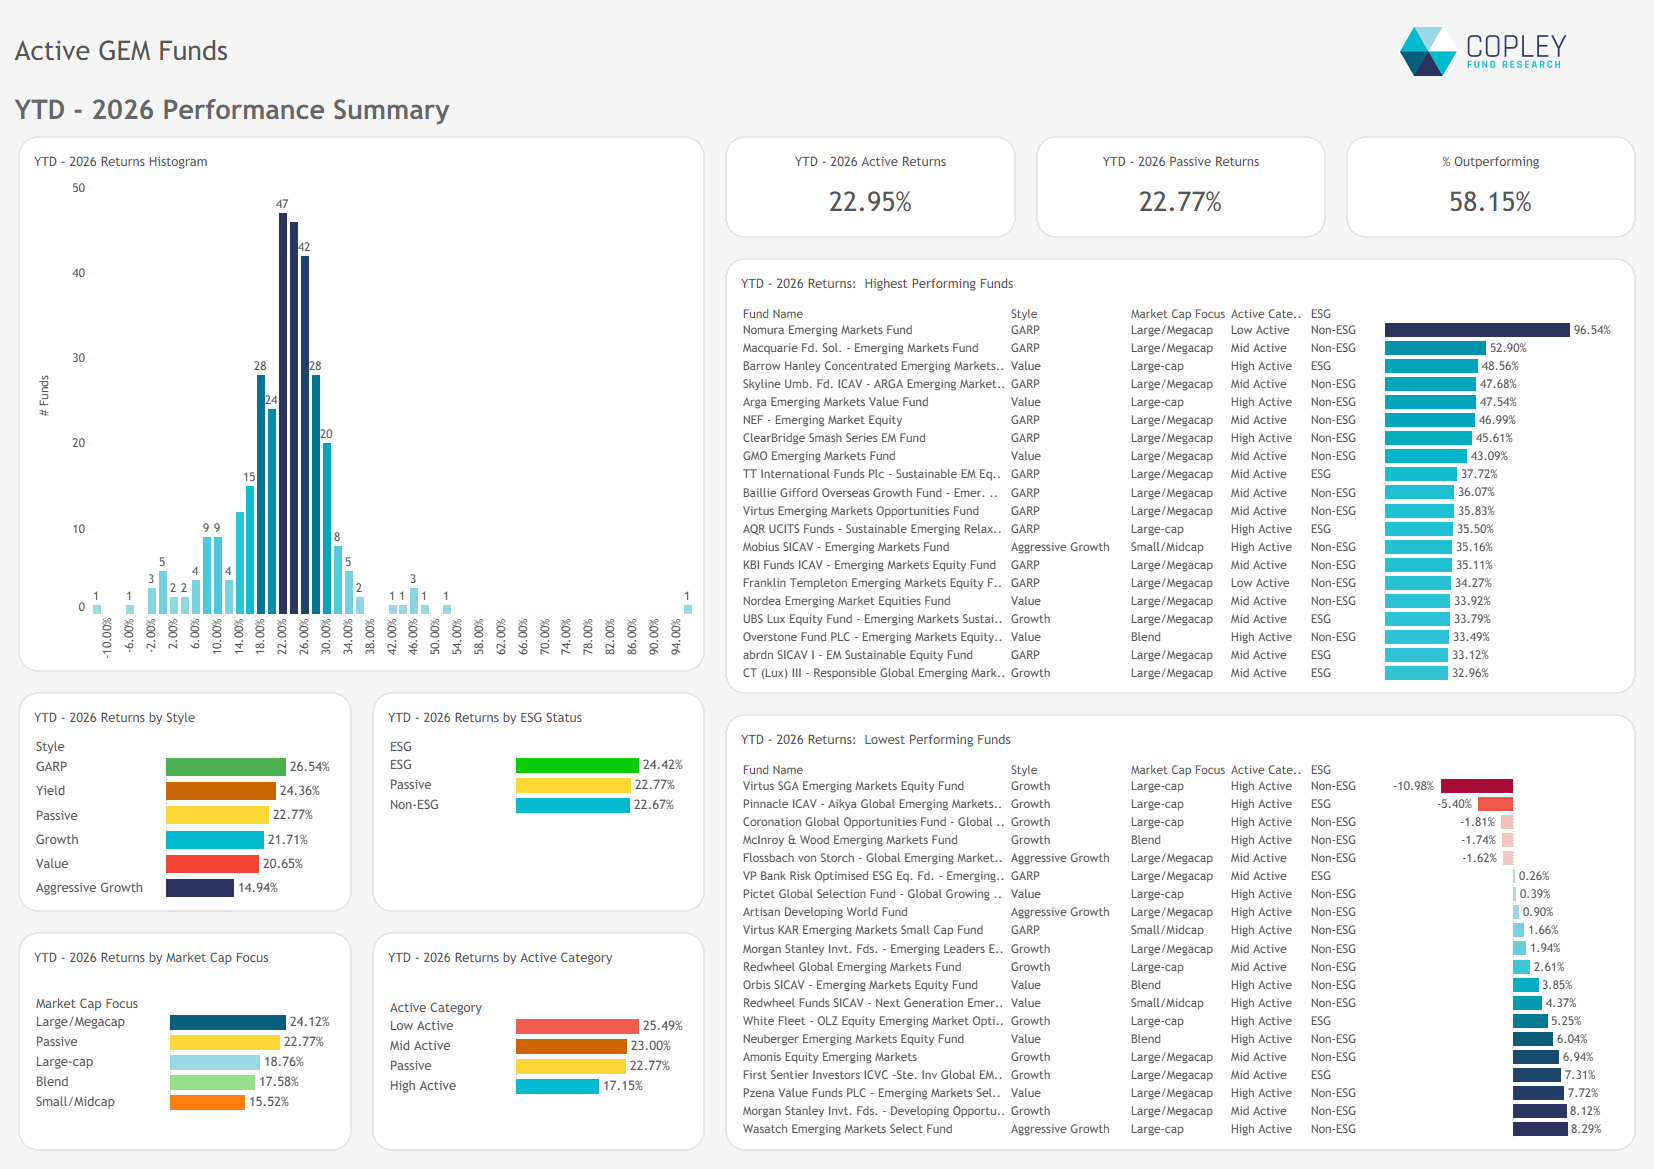
The average active GEM fund returned 22.95% in the first nine months of 2026, against 22.77% for the iShares MSCI Emerging Markets ETF. 58% of funds beat the index, with average alpha at a slim +0.18%.

Underneath, this is one of the most concentrated years for EM returns we have seen. This note breaks down the returns based on a portfolio of 347 active GEM funds, showing where managers won and lost against the benchmark, and which fund types came out ahead.

01 · Return contribution
Chart 1

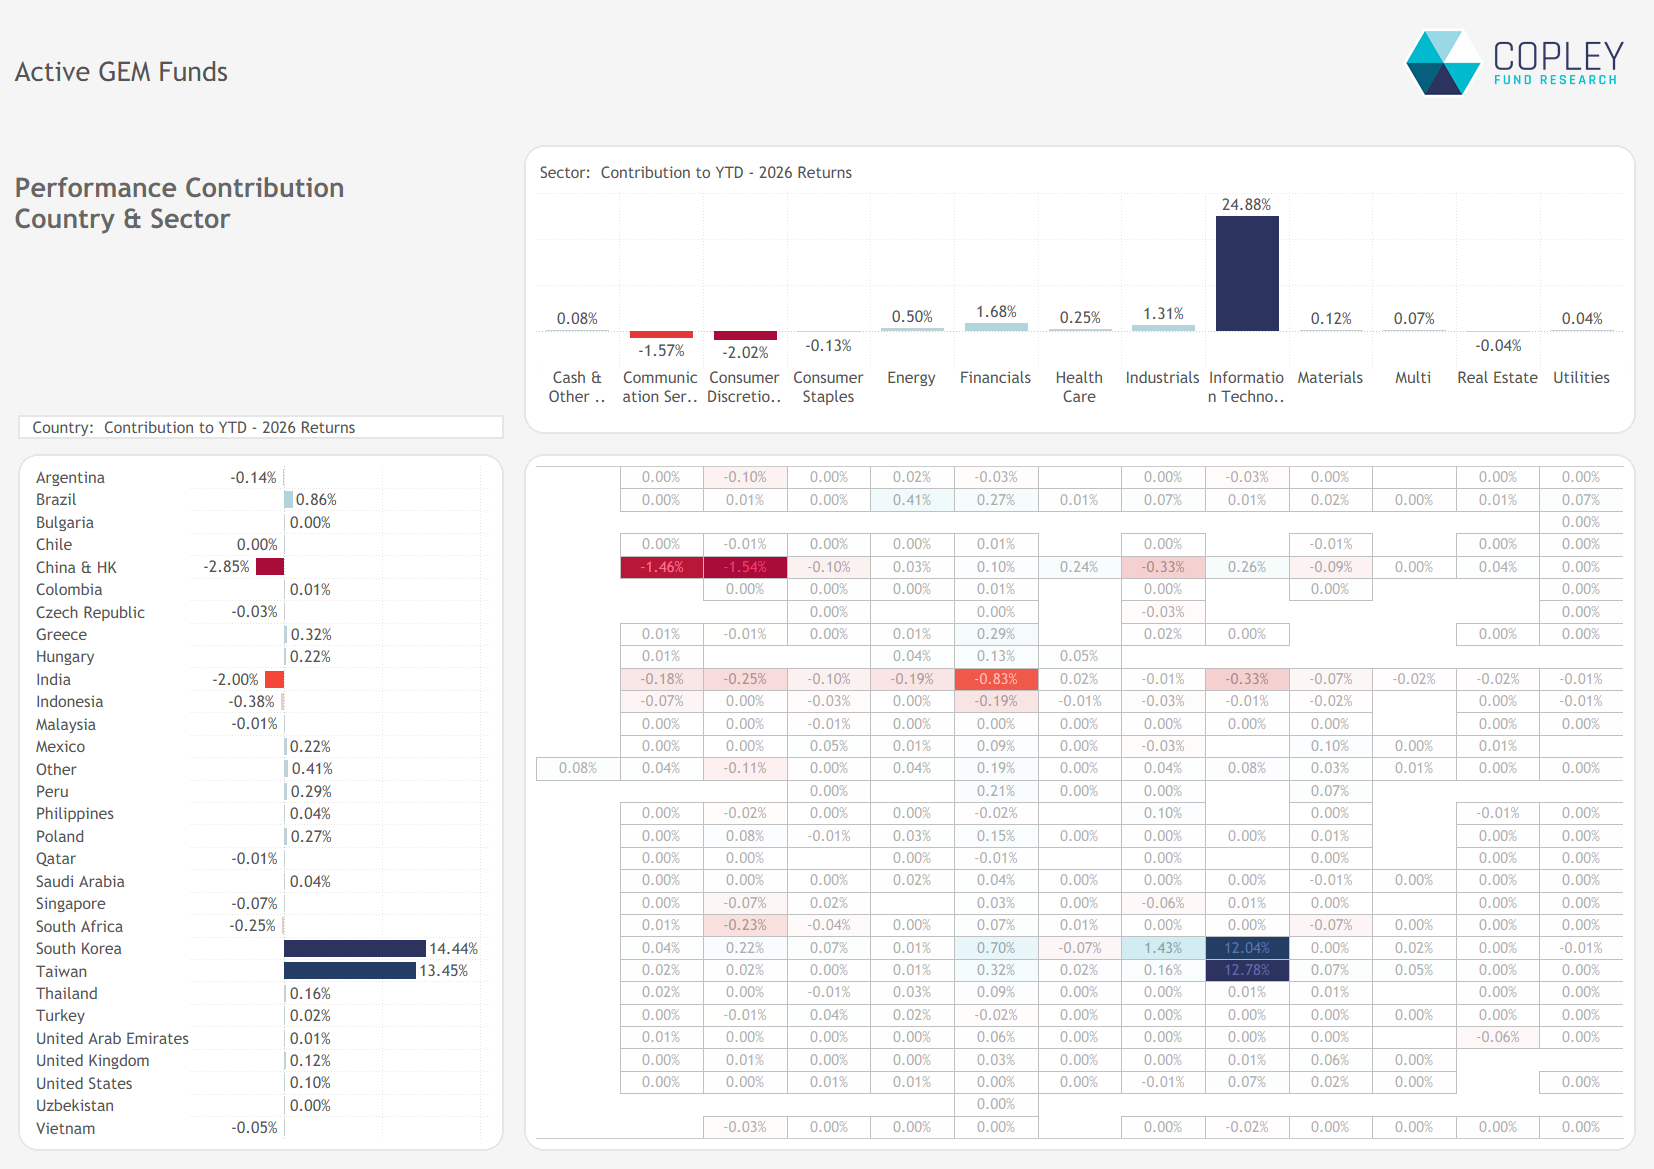
Korea and Taiwan tech delivered more than the whole return

South Korea (+14.44%) and Taiwan (+13.45%) have added 27.89% to the average fund return this year, about 120% of the total. Everything else detracted, with China & HK (-2.85%) and India (-2.00%) the most costly.

The sector view tells the same story. IT contributed 24.88%, and Korean and Taiwanese IT alone accounted for 24.82% of that. Strip those two out and the average GEM fund is down on the year.

Chart 2

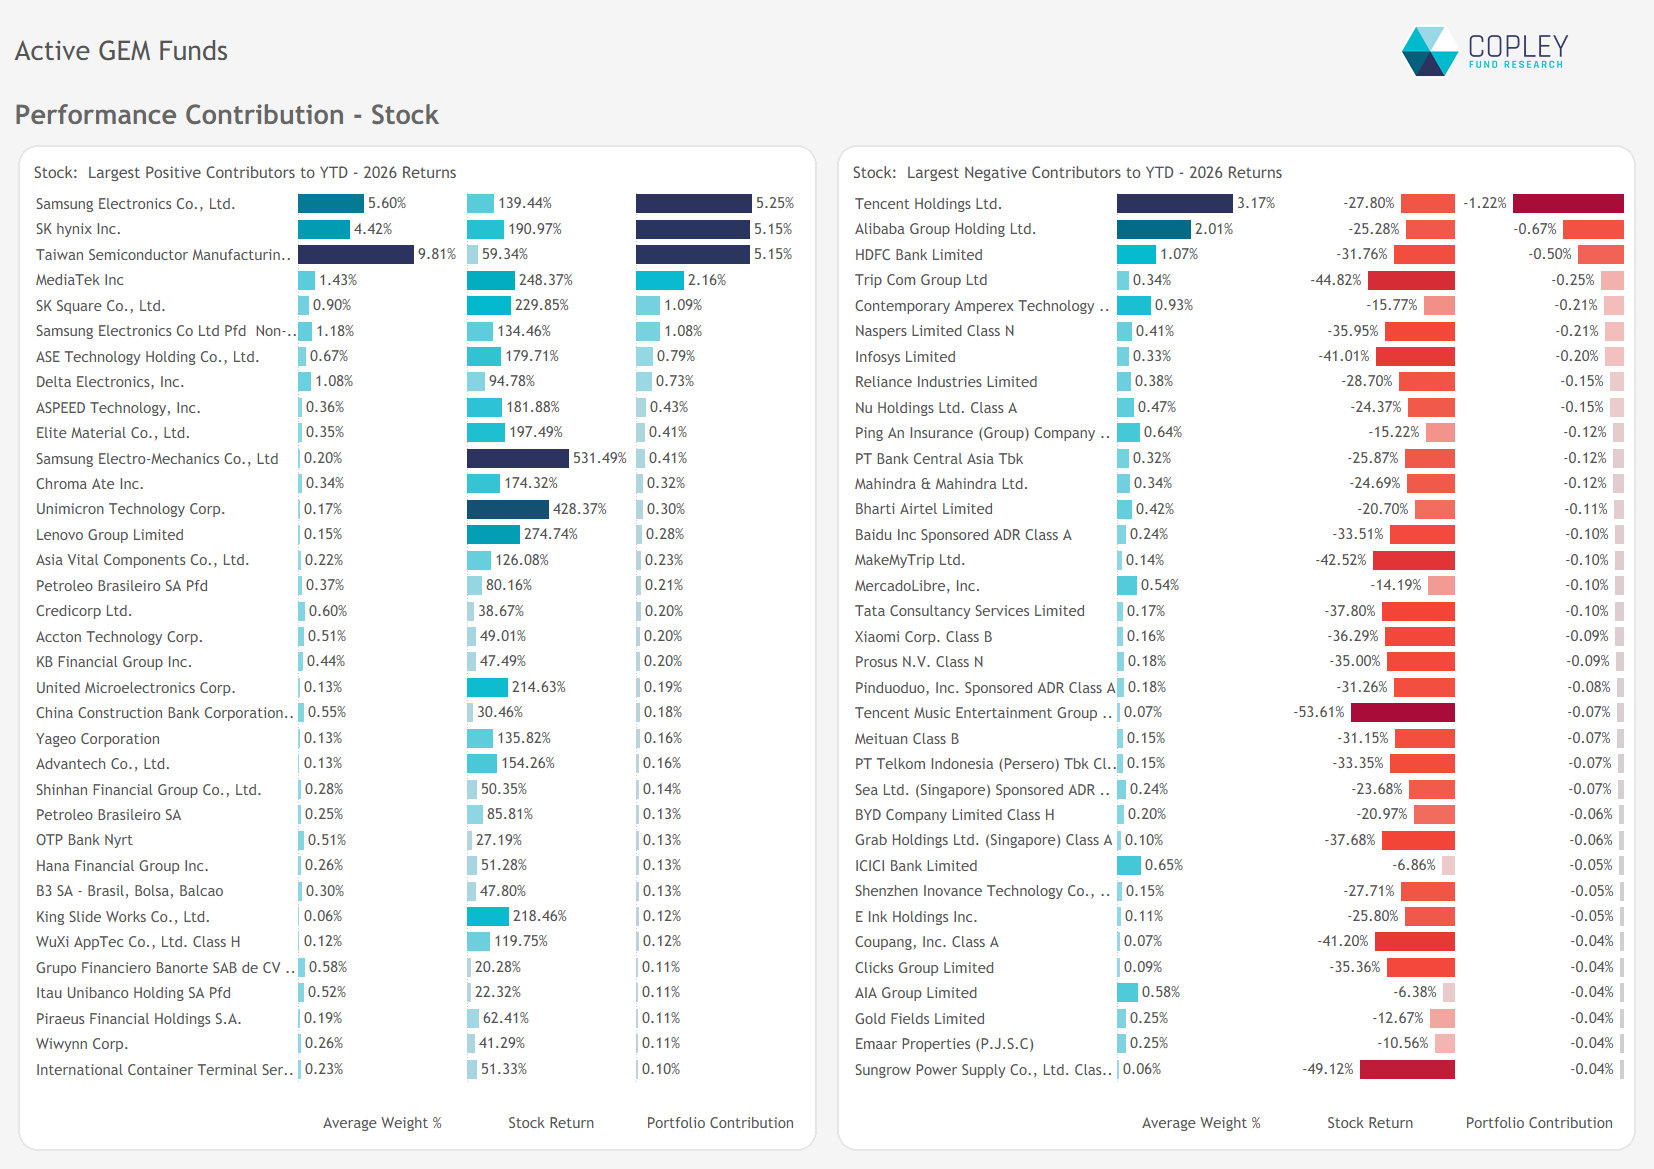
Three chip stocks did two-thirds of the work

Samsung Electronics (+5.25%), SK hynix (+5.15%) and TSMC (+5.15%) added 15.55% between them, 68% of the average fund’s return. MediaTek (+2.16%) and SK Square (1.09%) provided additional support.

The biggest detractors were among EM’s most widely held stocks: Tencent (-1.22%), Alibaba (-0.67%) and HDFC Bank (-0.50%) led the way.

02 · Attribution vs benchmark
Chart 3

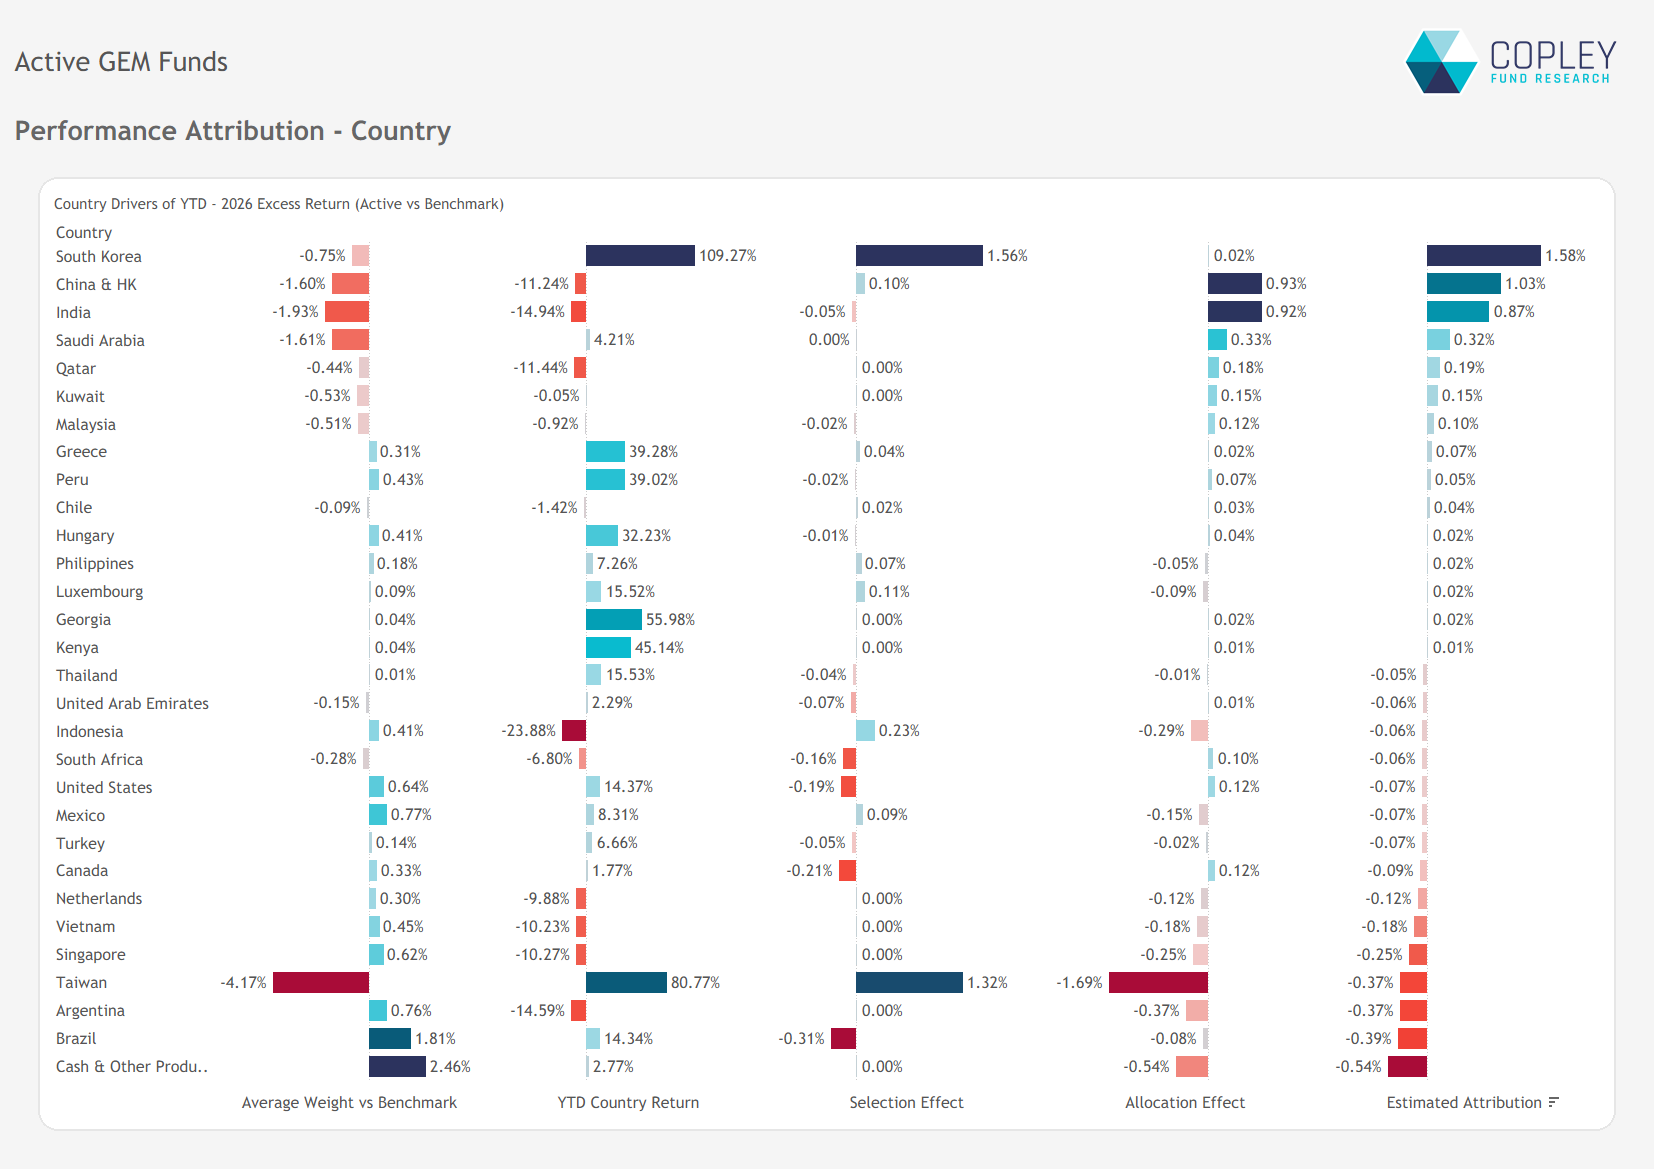
Wins in Korea, China and India; Taiwan the cost

The 0.18% lead over the index is the net result of several large calls that offset each other.

What added value: stock-picking in Korea (+1.58%, almost all selection). Underweights in China & HK (+1.03%) and India (+0.87%) also helped, as both markets fell double digits.

What subtracted value:

  • Taiwan. Being 4.17% underweight a market up 81% cost 1.69% in allocation effects. Strong stock selection clawed back 1.32%, leaving a net cost of 0.37%.
  • Cash. A 2.46% average weight cost 0.54%.
  • Brazil. The largest overweight cost 0.39%.
Chart 4

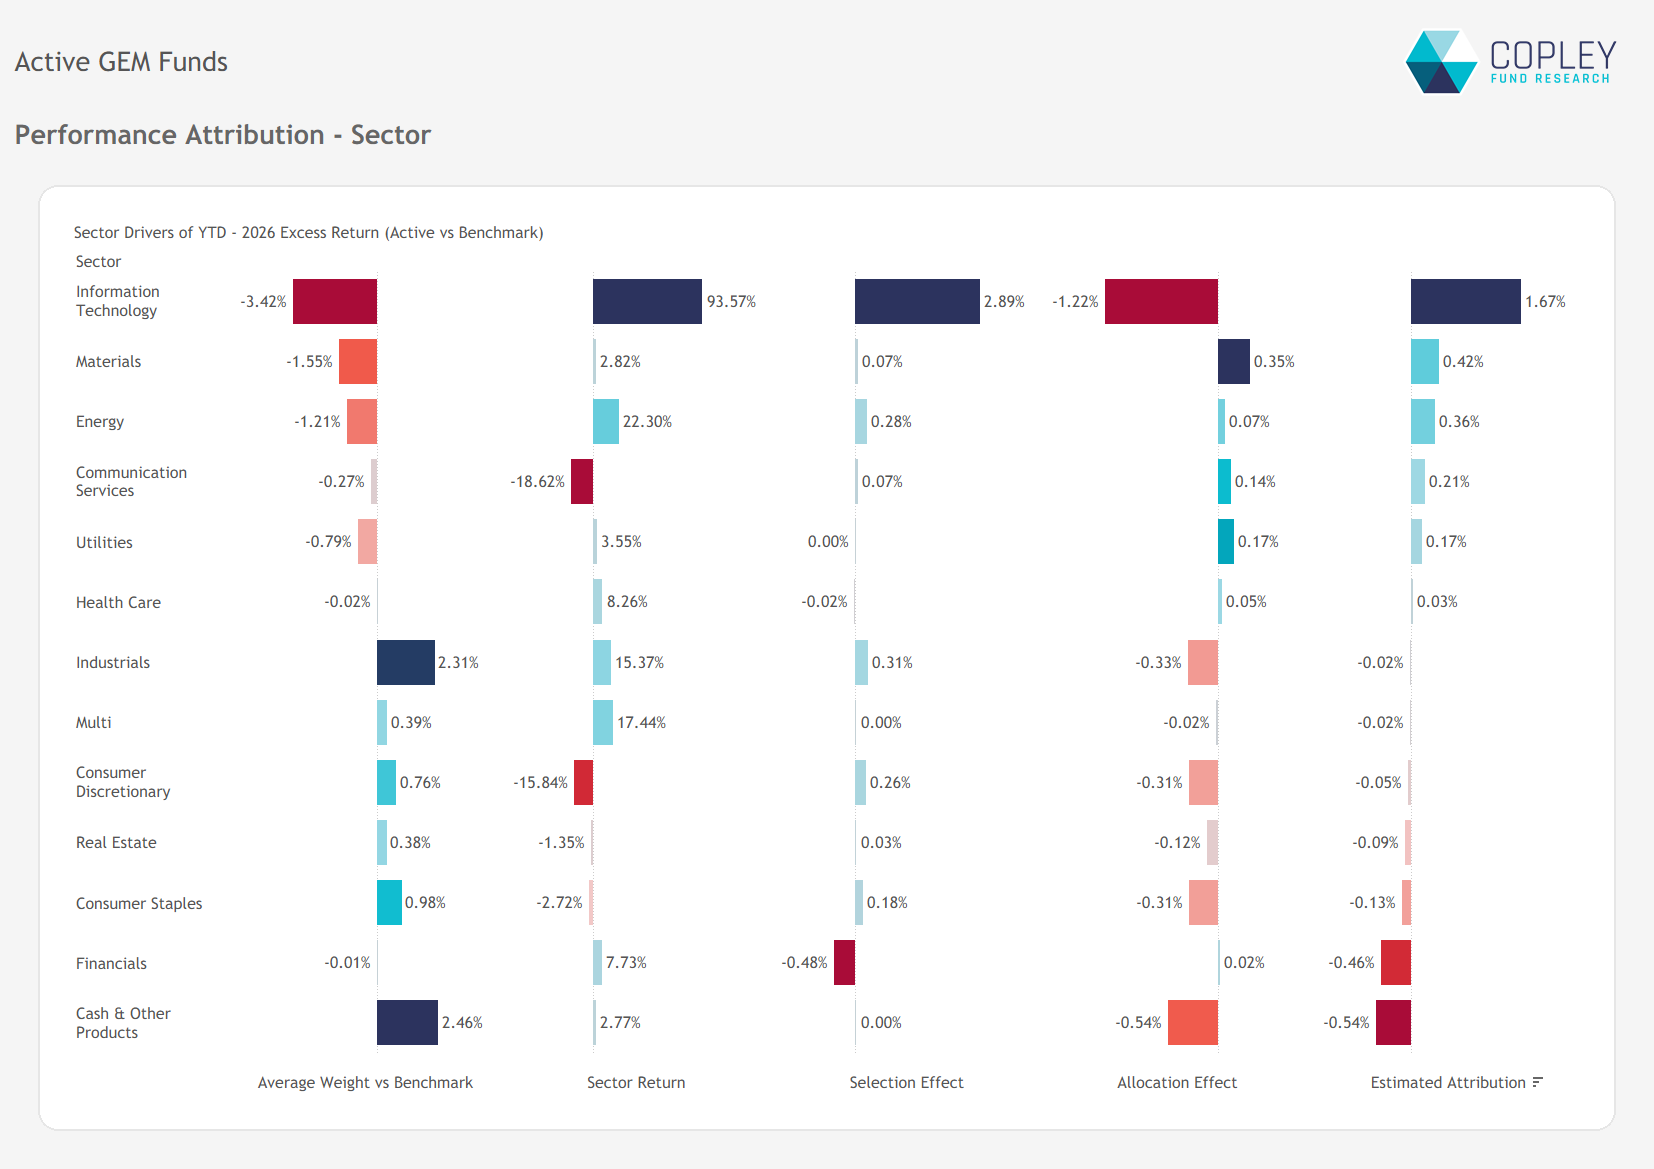
IT: right stocks, wrong size

Technology stocks added 1.67% of net outperformance. Stock selection added 2.89%, but being 3.42% underweight the sector gave back 1.22%. Elsewhere, underweights in Materials (+0.42%) and Energy (+0.36%) helped. Financials (-0.46%, all stock selection) and cash (-0.54%) were the main drags.

Chart 5

Avoiding the losers mattered as much as owning the winners

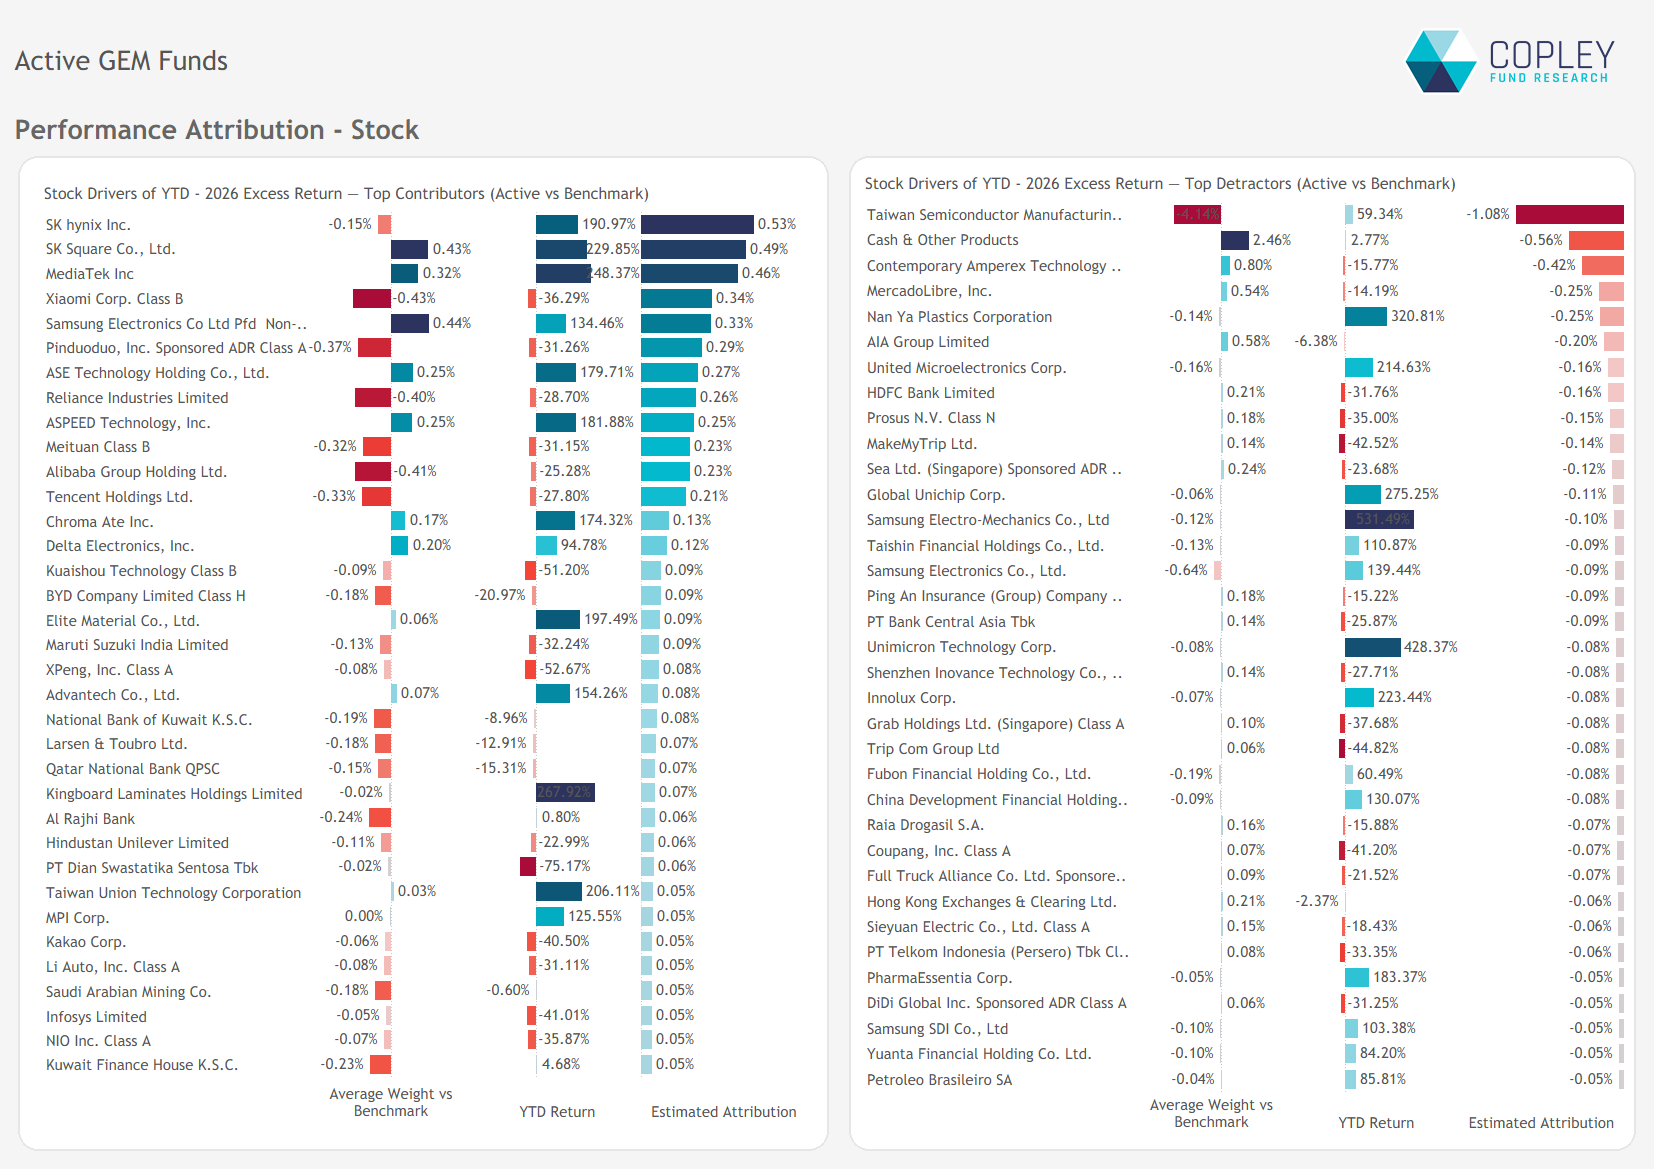
The top three relative contributors were Korean and Taiwanese tech: SK hynix (+0.53%), SK Square (+0.49%) and MediaTek (+0.46%). But much of the rest of the list came from what managers didn’t own. Underweights in falling China and India names added up: Xiaomi (+0.34%), Pinduoduo (+0.29%), Reliance (+0.26%), and Alibaba and Meituan (+0.23% each).

On the other side, TSMC was by far the largest detractor (-1.08%) on a 4.14% average underweight. Overweights in CATL (-0.42%) and MercadoLibre (-0.25%) also hurt. The rest of the list is the AI supply chain that managers were light on: Nan Ya Plastics (+321%) and UMC (+215%) both cost money despite only small underweights.

03 · Fund return summary
Chart 6

In a narrow market, staying close to the index paid off

When returns are this concentrated in a handful of mega-caps, the funds that owned them won.

  • Active share: low-active funds returned 25.49%, against 17.15% for high-active funds.
  • Market cap: large/megacap funds returned 24.12%; small/midcap funds managed 15.52%.
  • Style: GARP led at 26.54%. Aggressive growth trailed at 14.94%.

Dispersion was still wide. Nomura Emerging Markets returned 96.54%, while Virtus SGA Emerging Markets Equity lost 10.98%. Only five of the 347 funds lost money.

Extended Report

GEM Performance & Attribution Pack: Q3 2026

The full pack behind this piece: performance, country, sector and stock attribution for the average active GEM fund, plus 1, 3, 5 and 10-year peer rankings. 

Leave A Comment

Terms and Conditions

By purchasing an Investor Positioning Report, you agree to our full Terms and Conditions.

View Terms and Conditions →