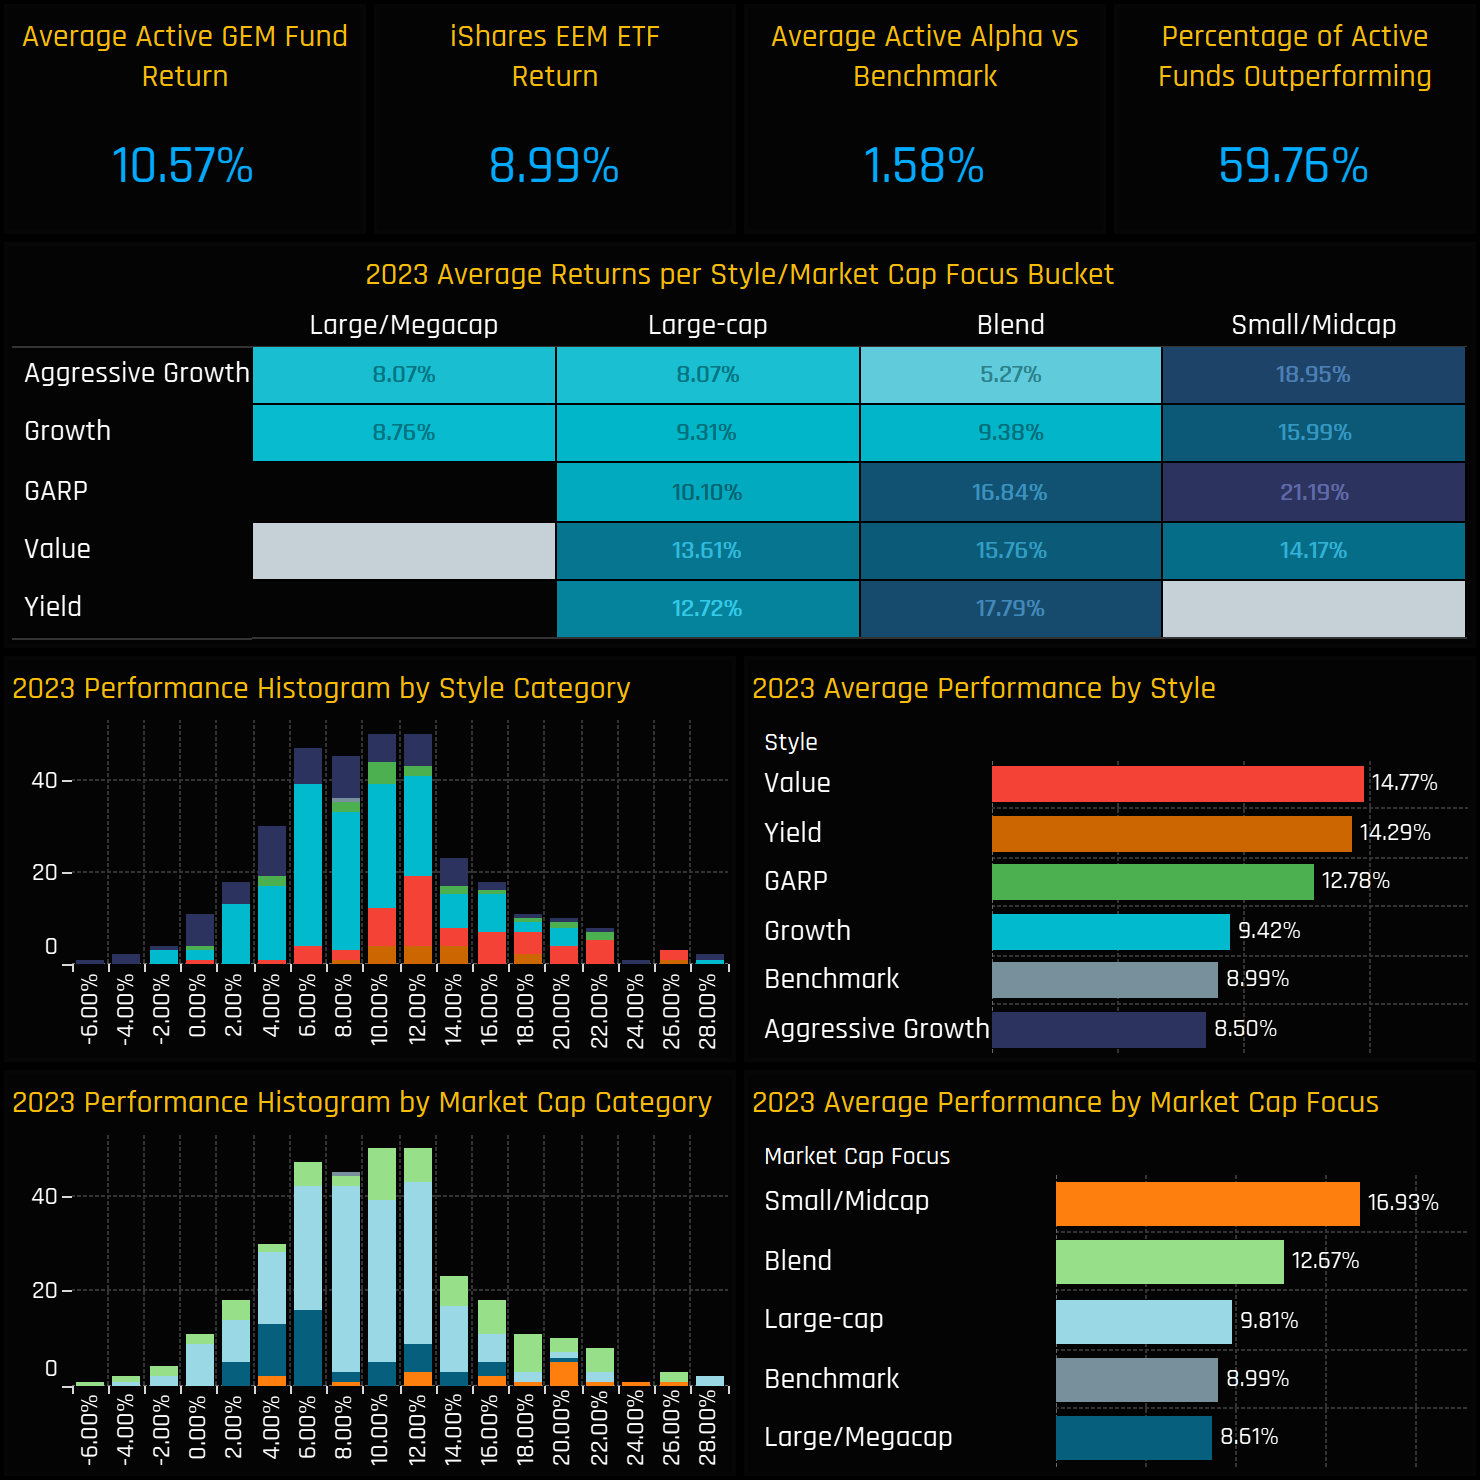
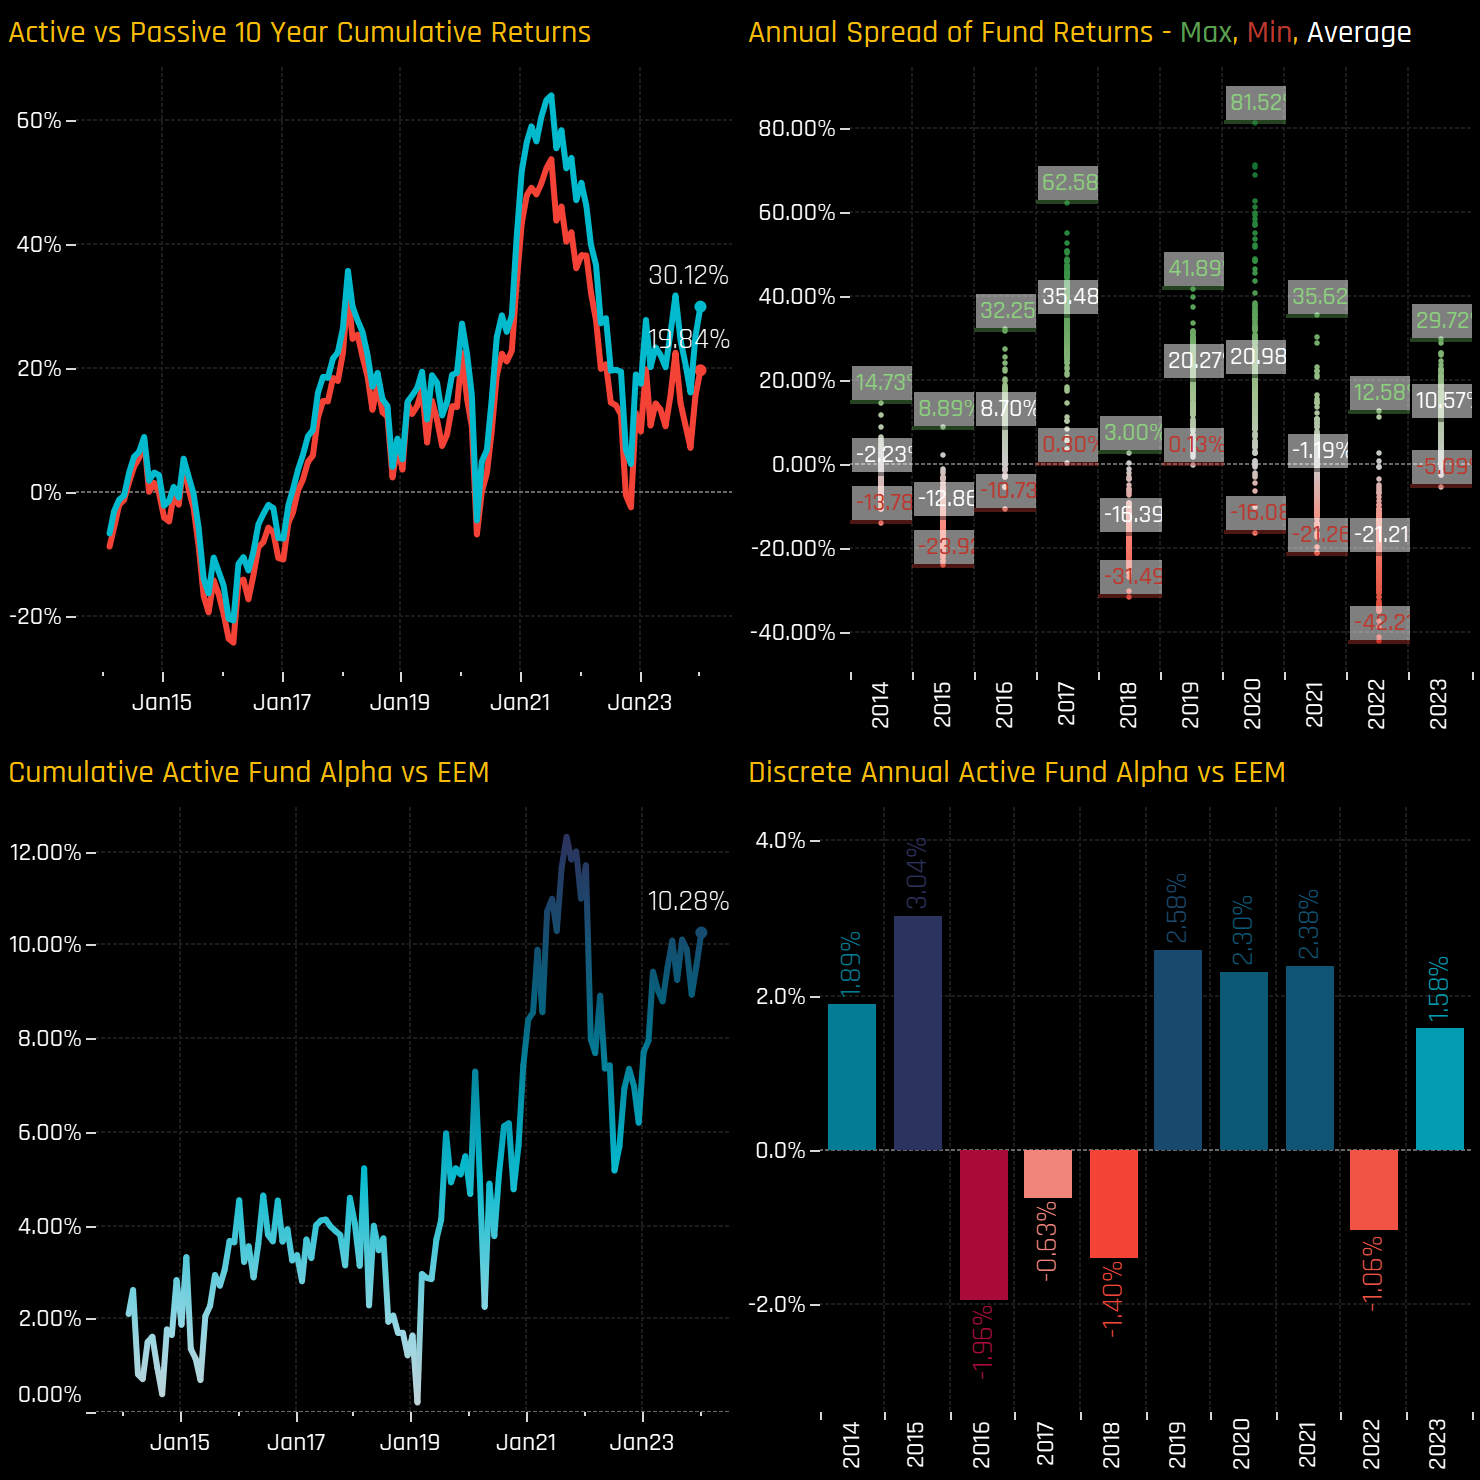
- 2023 was a good year for active EM managers, as 60% outperformed generating +1.6% of alpha versus the tradable benchmark, on average.
- Returns were driven higher by strong performance from Value and Small/Midcap managers, whilst high Growth struggled.
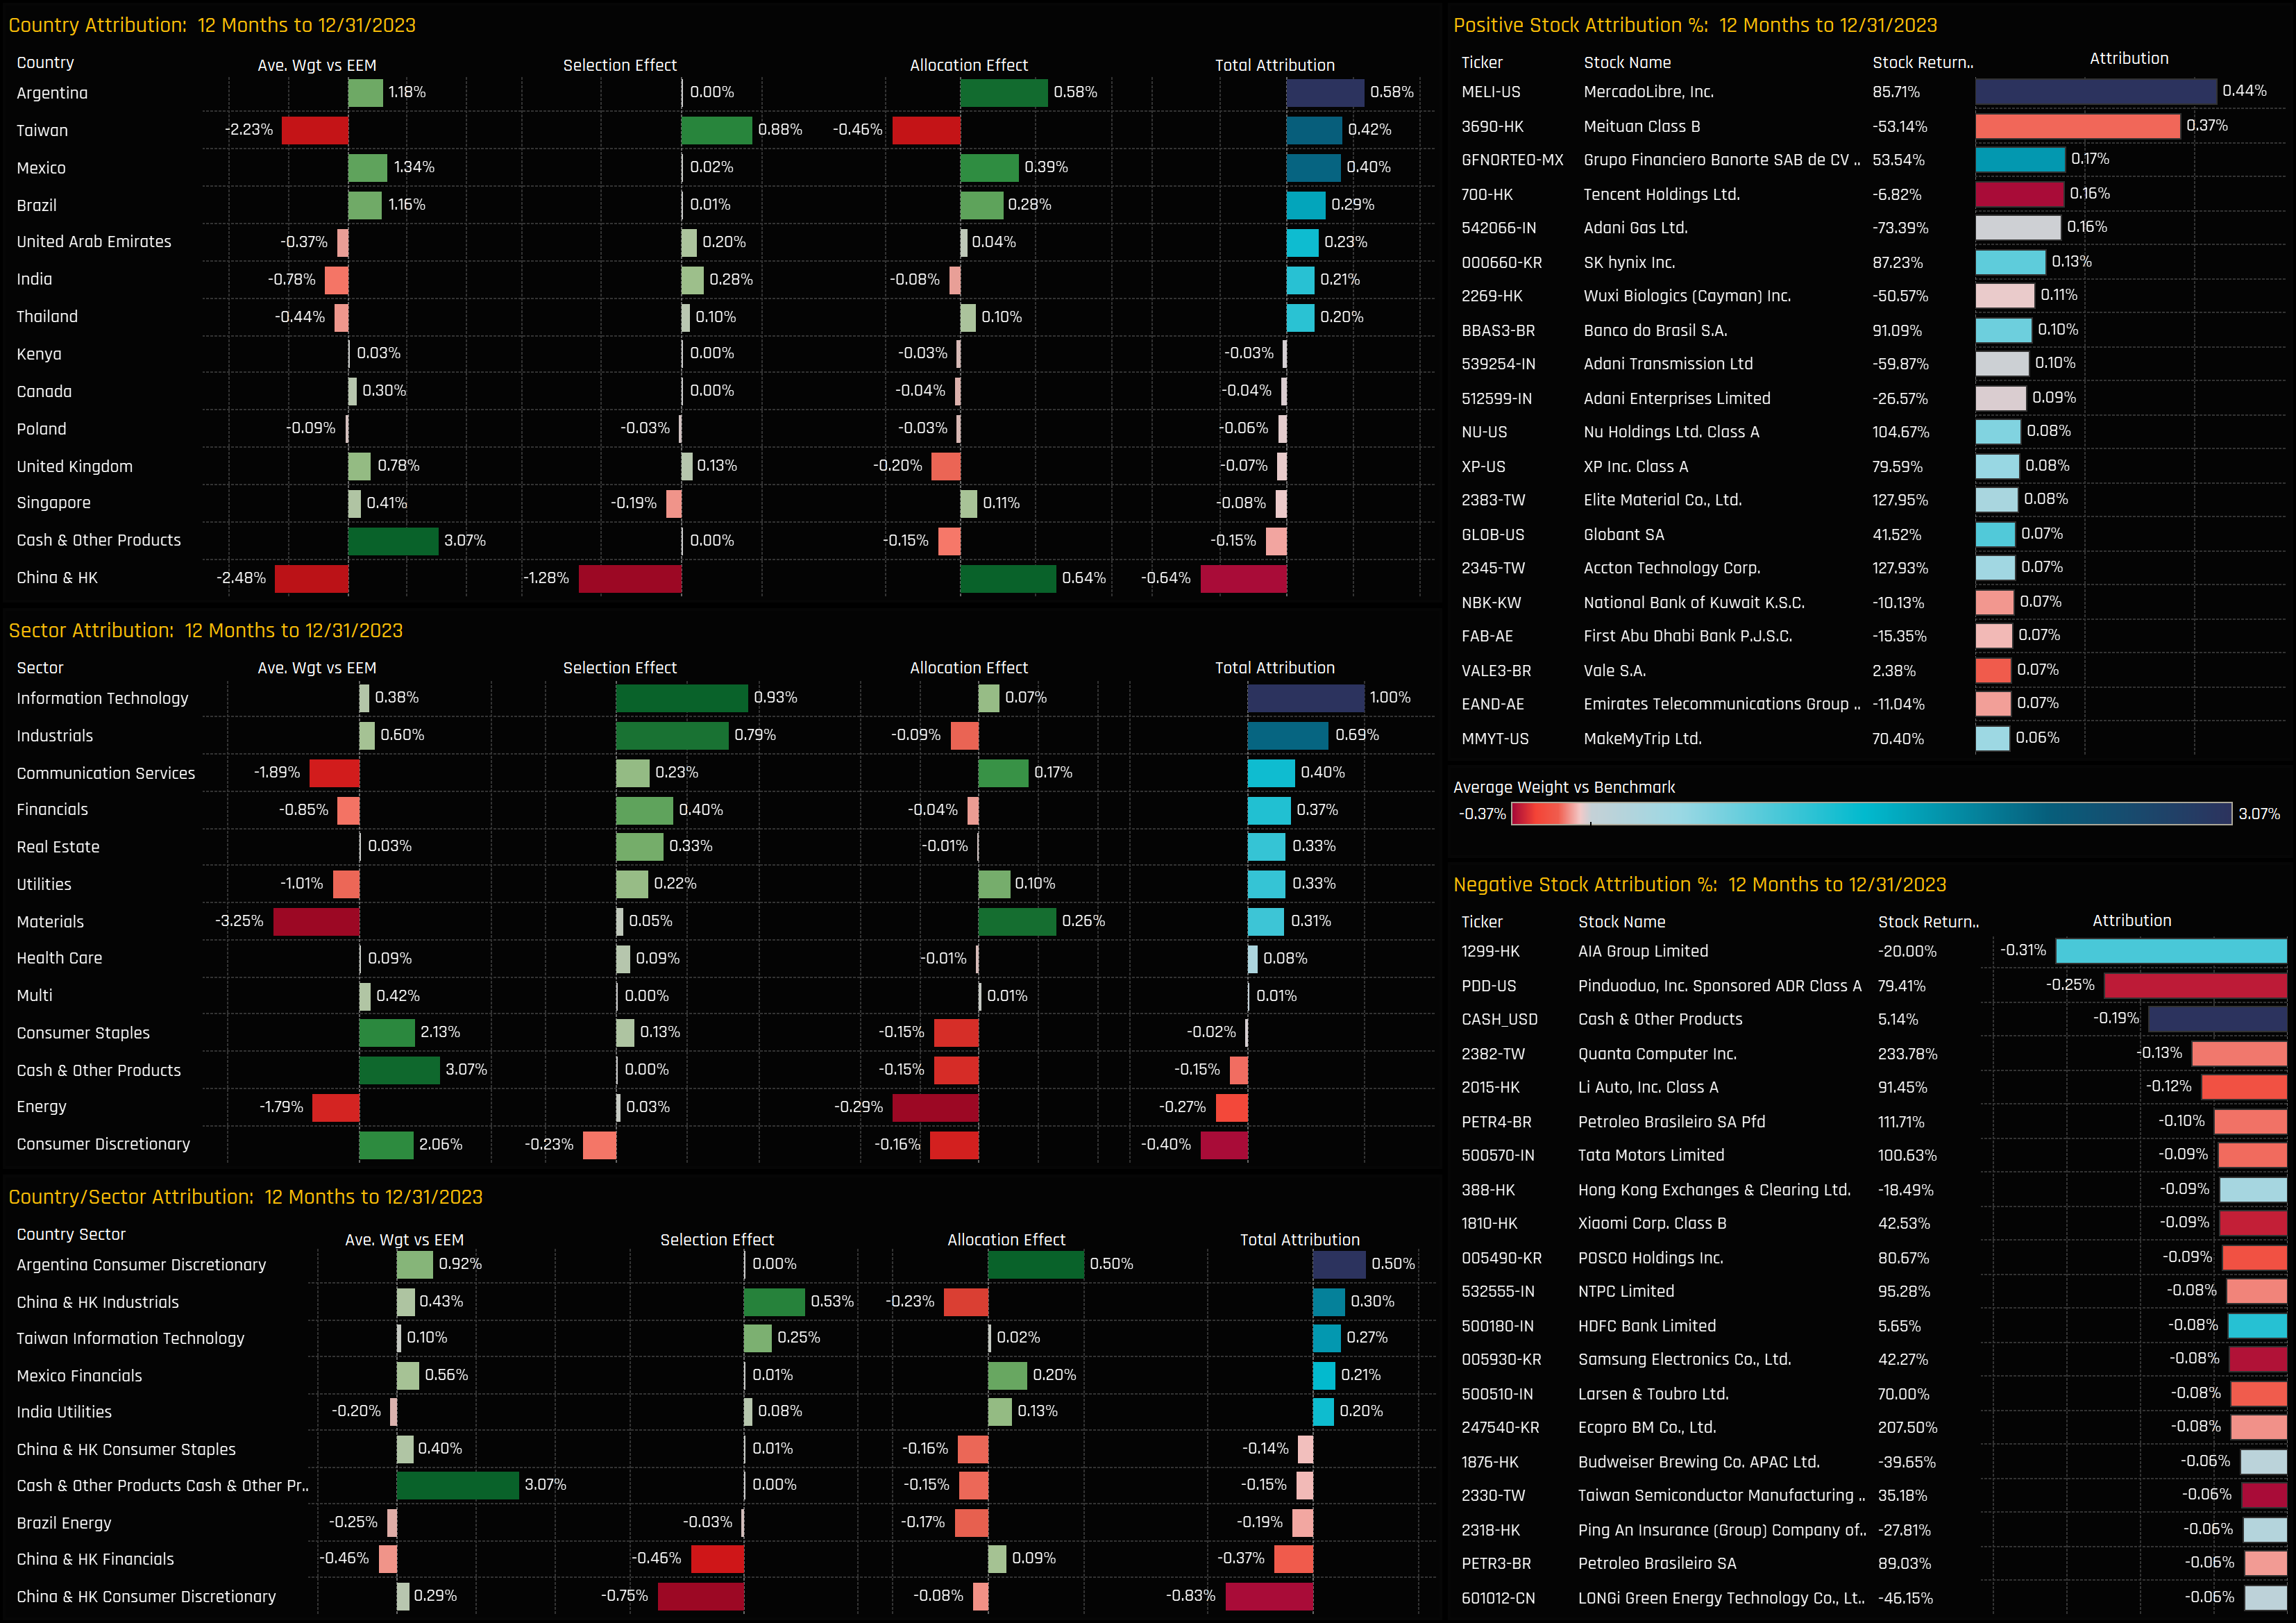
- China & HK positions were costly, whilst LATAM and Technology contributed the most to outperformance.
2023 Fund Performance
2023 Fund Performance
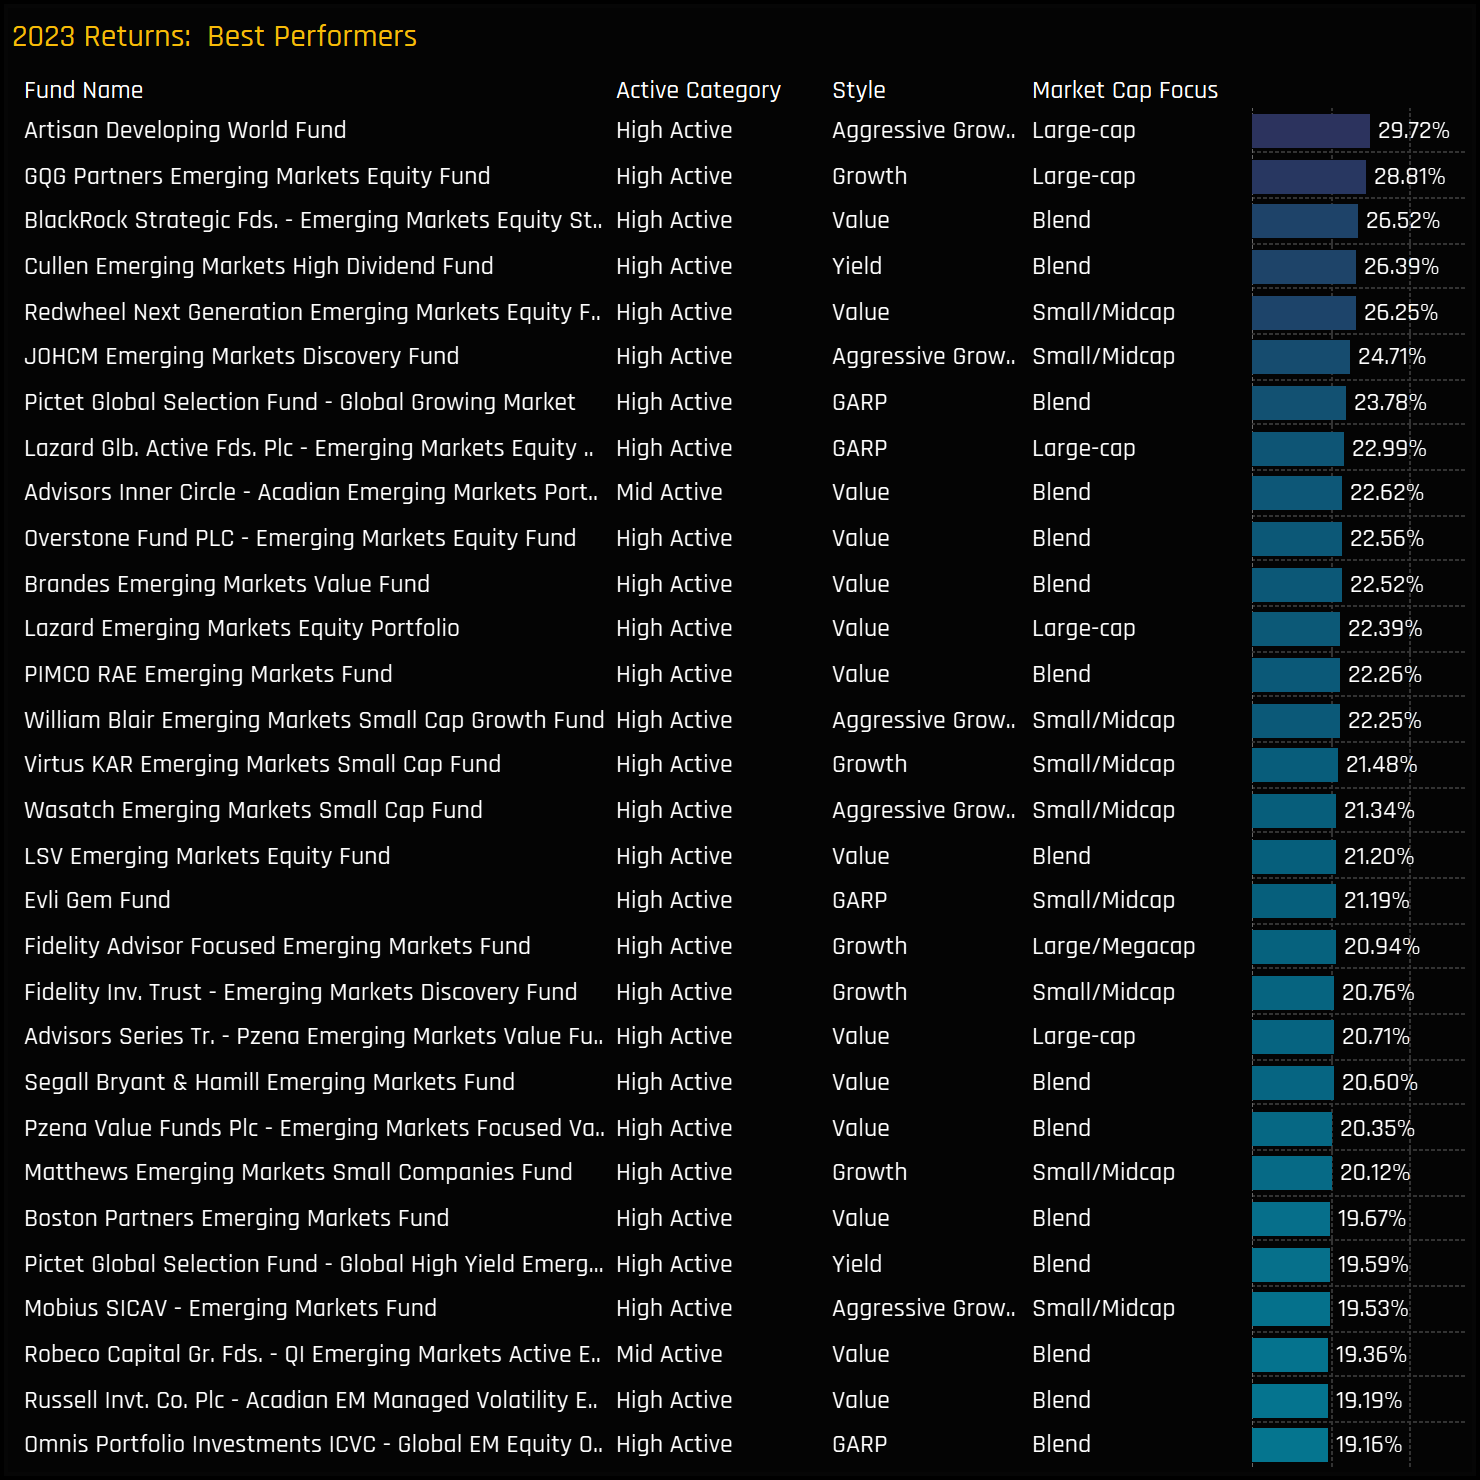
2023 Top Performers
In 2023, 24 GEM funds achieved returns exceeding 20%. Leading the pack were Artisan Developing World at 29.7%, GQG EM Equity at 28.8%, and BlackRock’s Value/Blend EM Equity strategy at 26.5%. Notably, despite the list predominantly featuring Value strategies, the top two positions were secured by Growth-oriented funds. Our analysis indicates that both top performers diverged from conventional emerging markets strategies by incorporating high-growth developed market stocks with emerging market income streams.
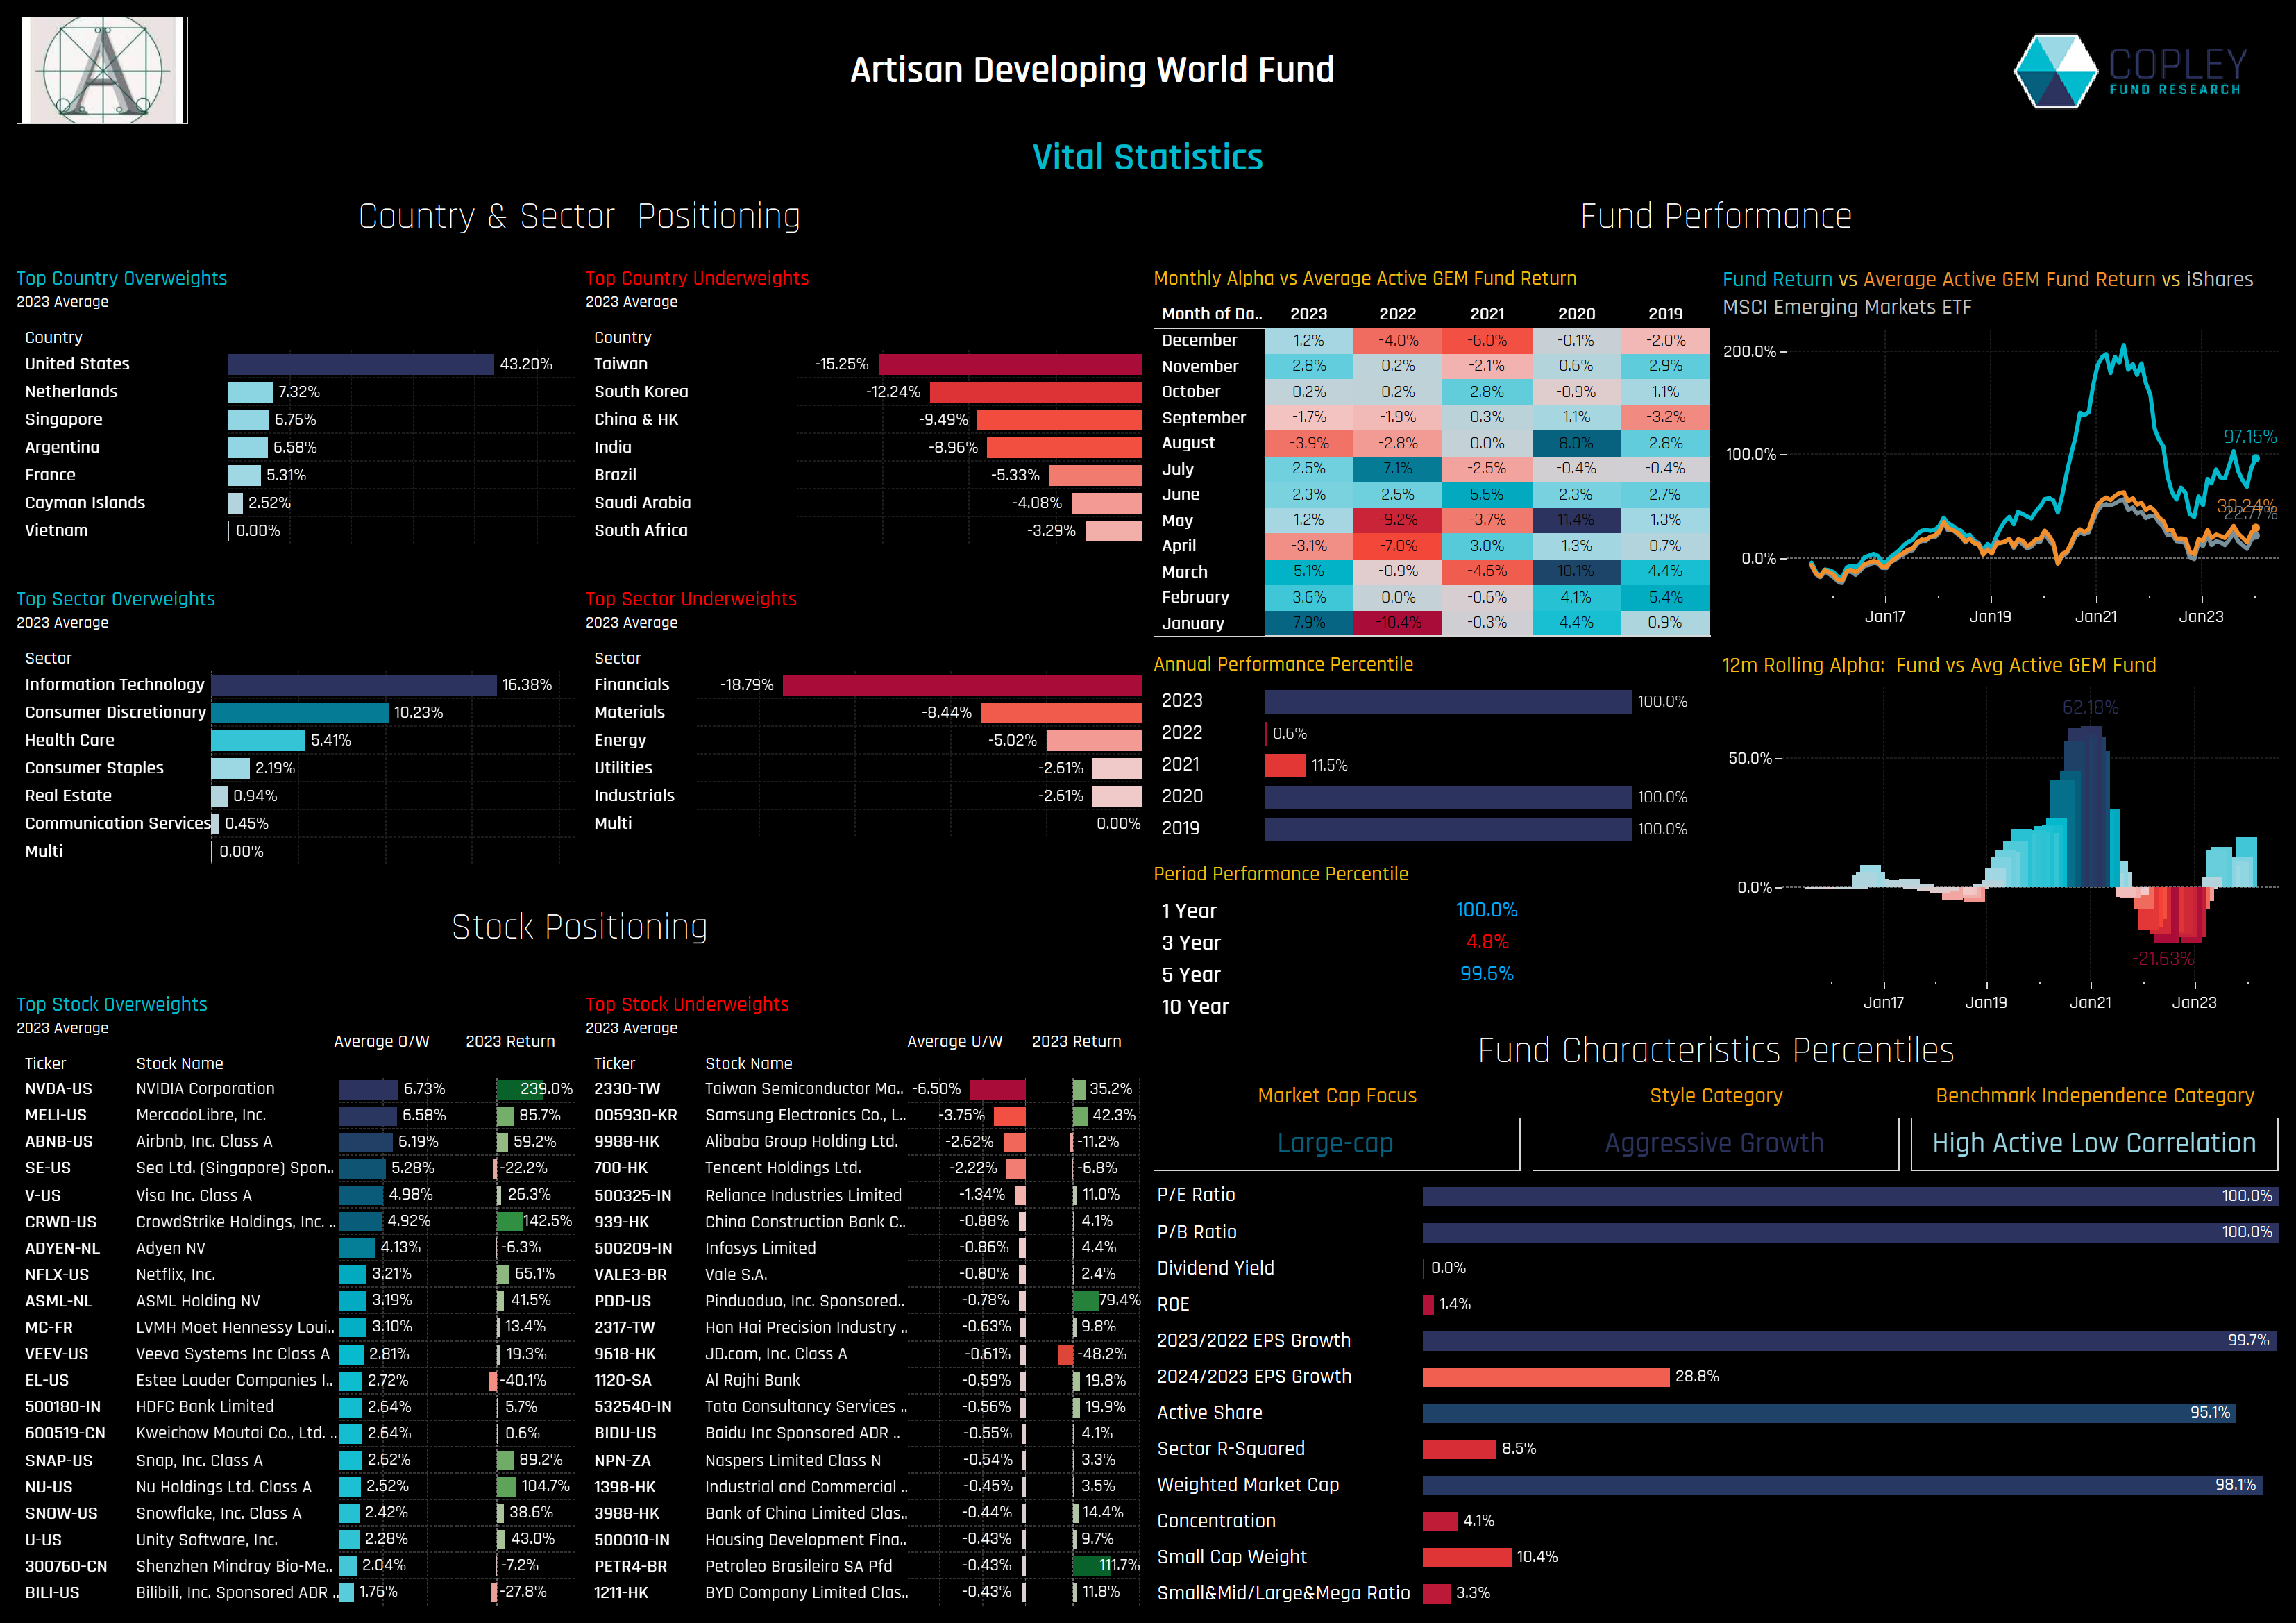
Artisan Developing World Fund
Artisan’s Developing World fund has topped the performance charts for another year, repeating the successes of 2019 and 2020, and rebounding strongly from its lower rankings in 2021 and 2022. The fund, whilst benchmarked against the MSCI Emerging Markets Index, blends its investments in emerging markets with a significant allocation to developed market stocks, especially those generating substantial income streams from emerging market countries. As such, the fund held all major Emerging Market countries as significant underweight positions through 2023, led by Taiwan (average underweight of -15.25%), South Korea (-12.24%) and China & HK (-9.49%). Instead, it held an average overweight in US stocks of 43.2% over the year, and 65% in Developed Market securities overall. The fund’s strategy is geared towards high growth, and it has the highest P/E and P/B ratios among the 365 EM funds in our analysis. Returns last year were driven by strong performance in key holdings such as NVIDIA, MercadoLibre and CrowdStrike Holdings, whilst also avoiding the key EM underperformers of Alibaba and Tencent.
Active vs Passive in EM
The spread between the highest and lowest returns on the year was 34.8%, with fewer occurrences of extreme outperformance than in 2020 or of extreme underperformance than in 2022. Cumulative 10-year returns for the active EM funds in our analysis stands at 30.12% versus 19.84% for the iShares MSCI EM ETF.
On an discrete annual basis, 2023 was the 4th year of outperformance for EM funds over the last 5-years. This year’s +1.58% alpha helped push 10-year cumulative outperformance over the iShares MSCI Emerging Markets ETF to +10.28%.
The Drivers of Outperformance
How did active EM managers outperform last year? We perform attribution analysis on a portfolio based on the average holding weights of the 365 individual strategies in our analysis, versus a representation of the benchmark based on the iShares MSCI Emerging Markets ETF. As expected, and mirroring the outperformance seen in actual fund returns last year, the portfolio outperformed by +2.67% in 2023. The winning positions on the year include LATAM overweights, China & HK underweights and excellent stock selection in Technology and Industrials. These positions far outweighed losses stemming from underweights in Taiwan, Cash Holdings and poor stock selection in China & HK.
Analysis taken from our Emerging Markets positioning research, covering 365 active strategies with a combined AUM of $400bn. For more information on our research, contact me directly on the email below.
Related Posts

- Steve Holden
- February 28, 2024
Global EM Funds: Country Positioning Update
361 emerging market Funds, AUM $400bn Country Positioning Update • China weights fall to lowe ..

- Steve Holden
- December 19, 2023
Saudi Arabia Special Report: A Tipping Point in EM Equity Allocations
2023 marks a pivotal year with EM investors significantly increasing holdings in the Saudi mark ..

- Steve Holden
- April 18, 2023
TSMC: Crowded Trade?
384 emerging market Funds, AUM $400bn TSMC: Crowded Trade? Active EM managers are heavily posit ..

