Riding High: The Magnificent 7 Surge in Global Equity Funds
- Steve Holden
- 0 Comments
- The Magnificent 7, comprising Microsoft, Apple, Alphabet, Amazon, Meta, NVIDIA and Tesla have hit record high allocations among active Global equity funds this year.
- Thought of as a standalone allocation, they represent the 2nd largest country weight, but also stand as a sizeable underweight versus the benchmark.
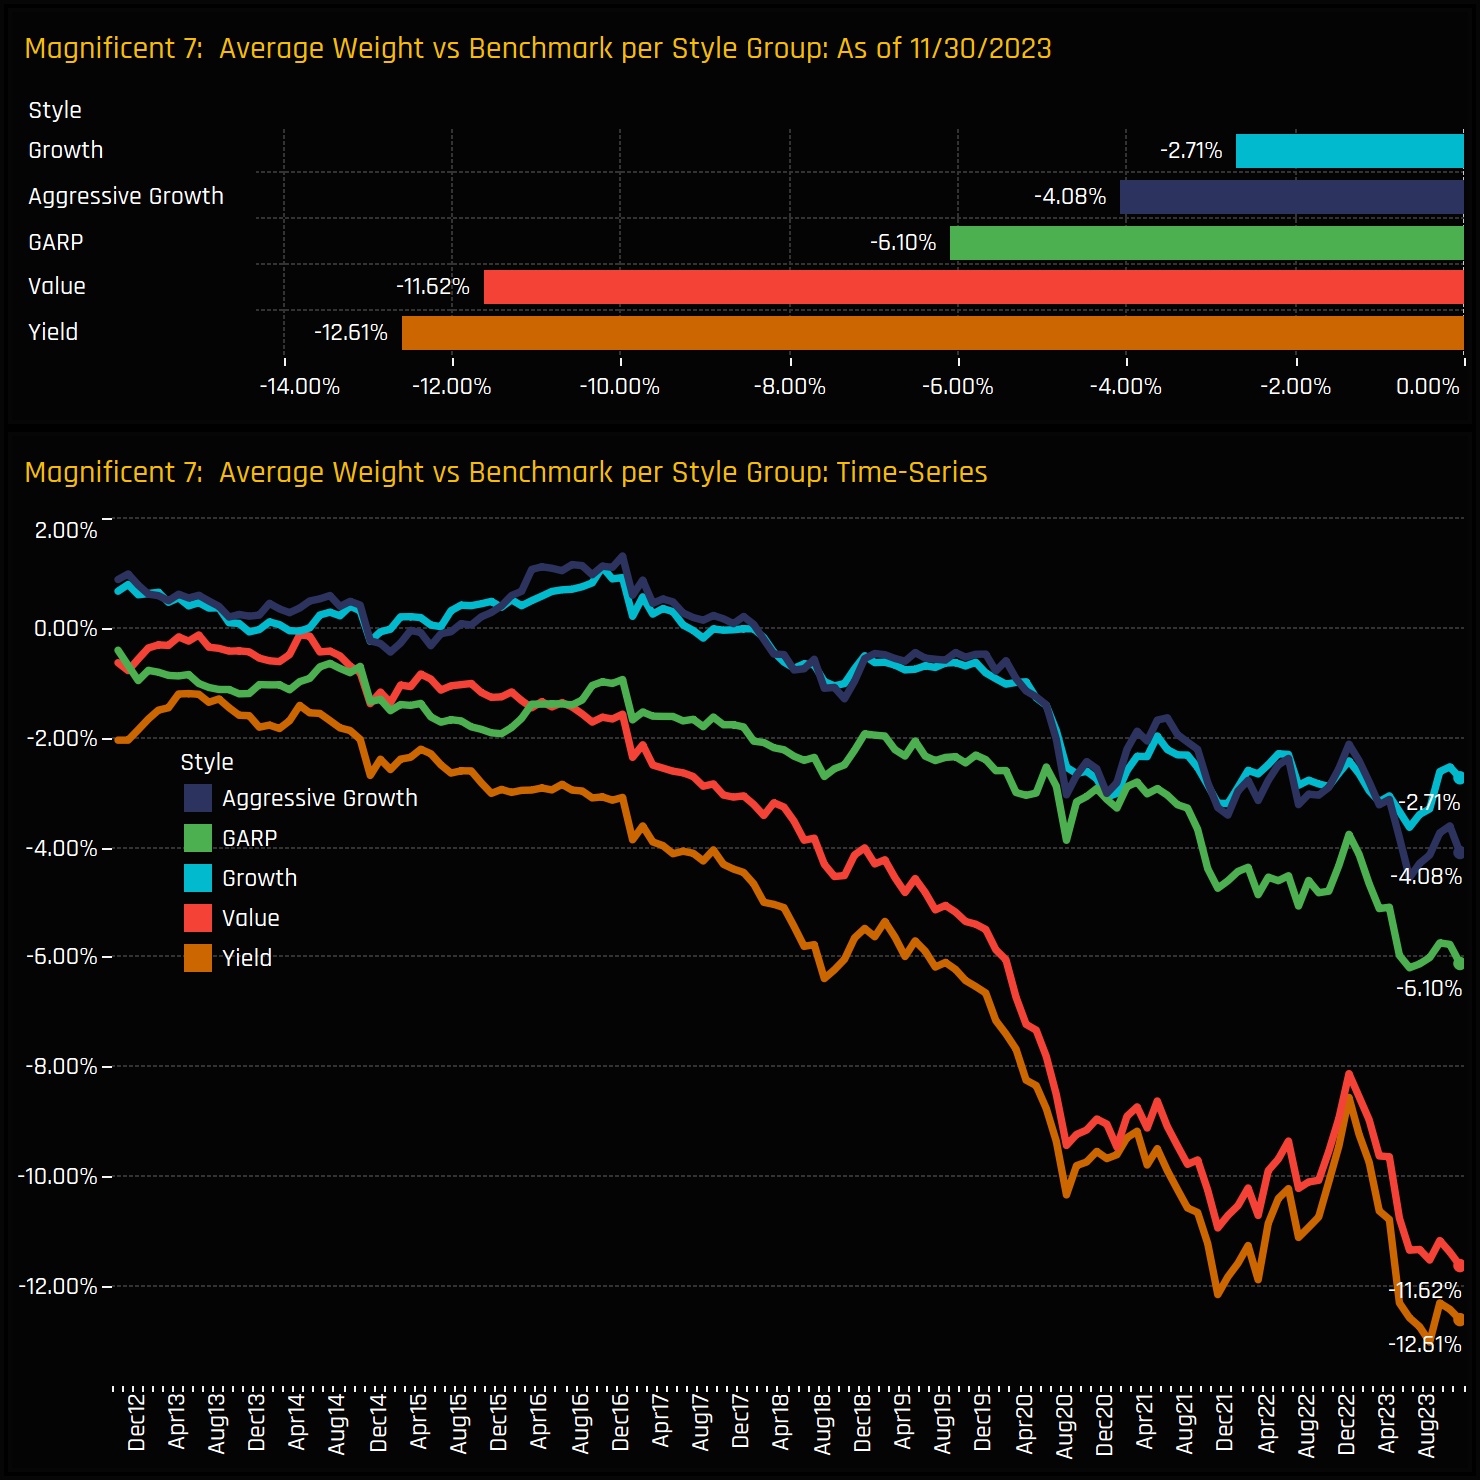
- Value funds continue to find reasons to sell, with underweights growing in magnitude as key funds close out.
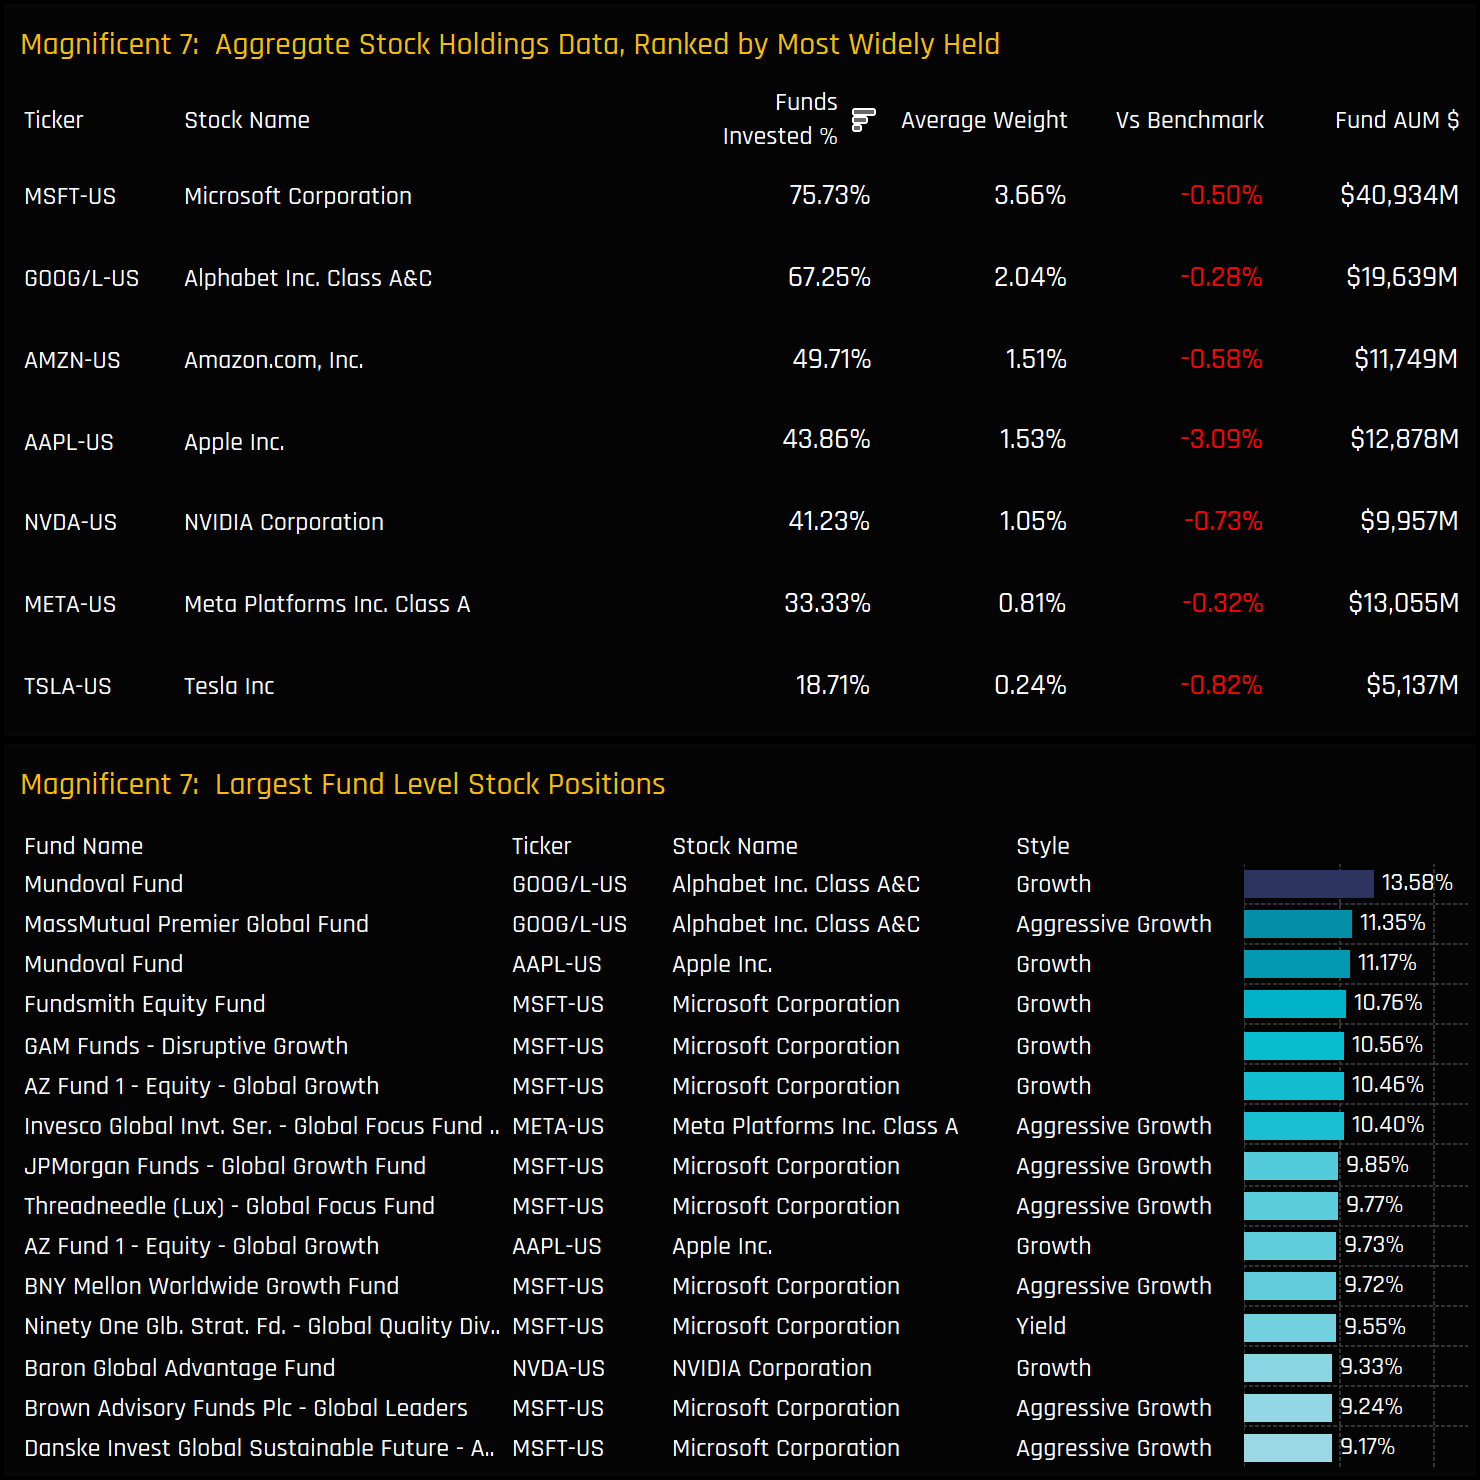
Microsoft‘s dominates the group, NVIDIA has attracted a new investors this year, whilst Tesla has struggled to gain the same level of trust from active Global investors.
Magnificent 7 Ownership Trends
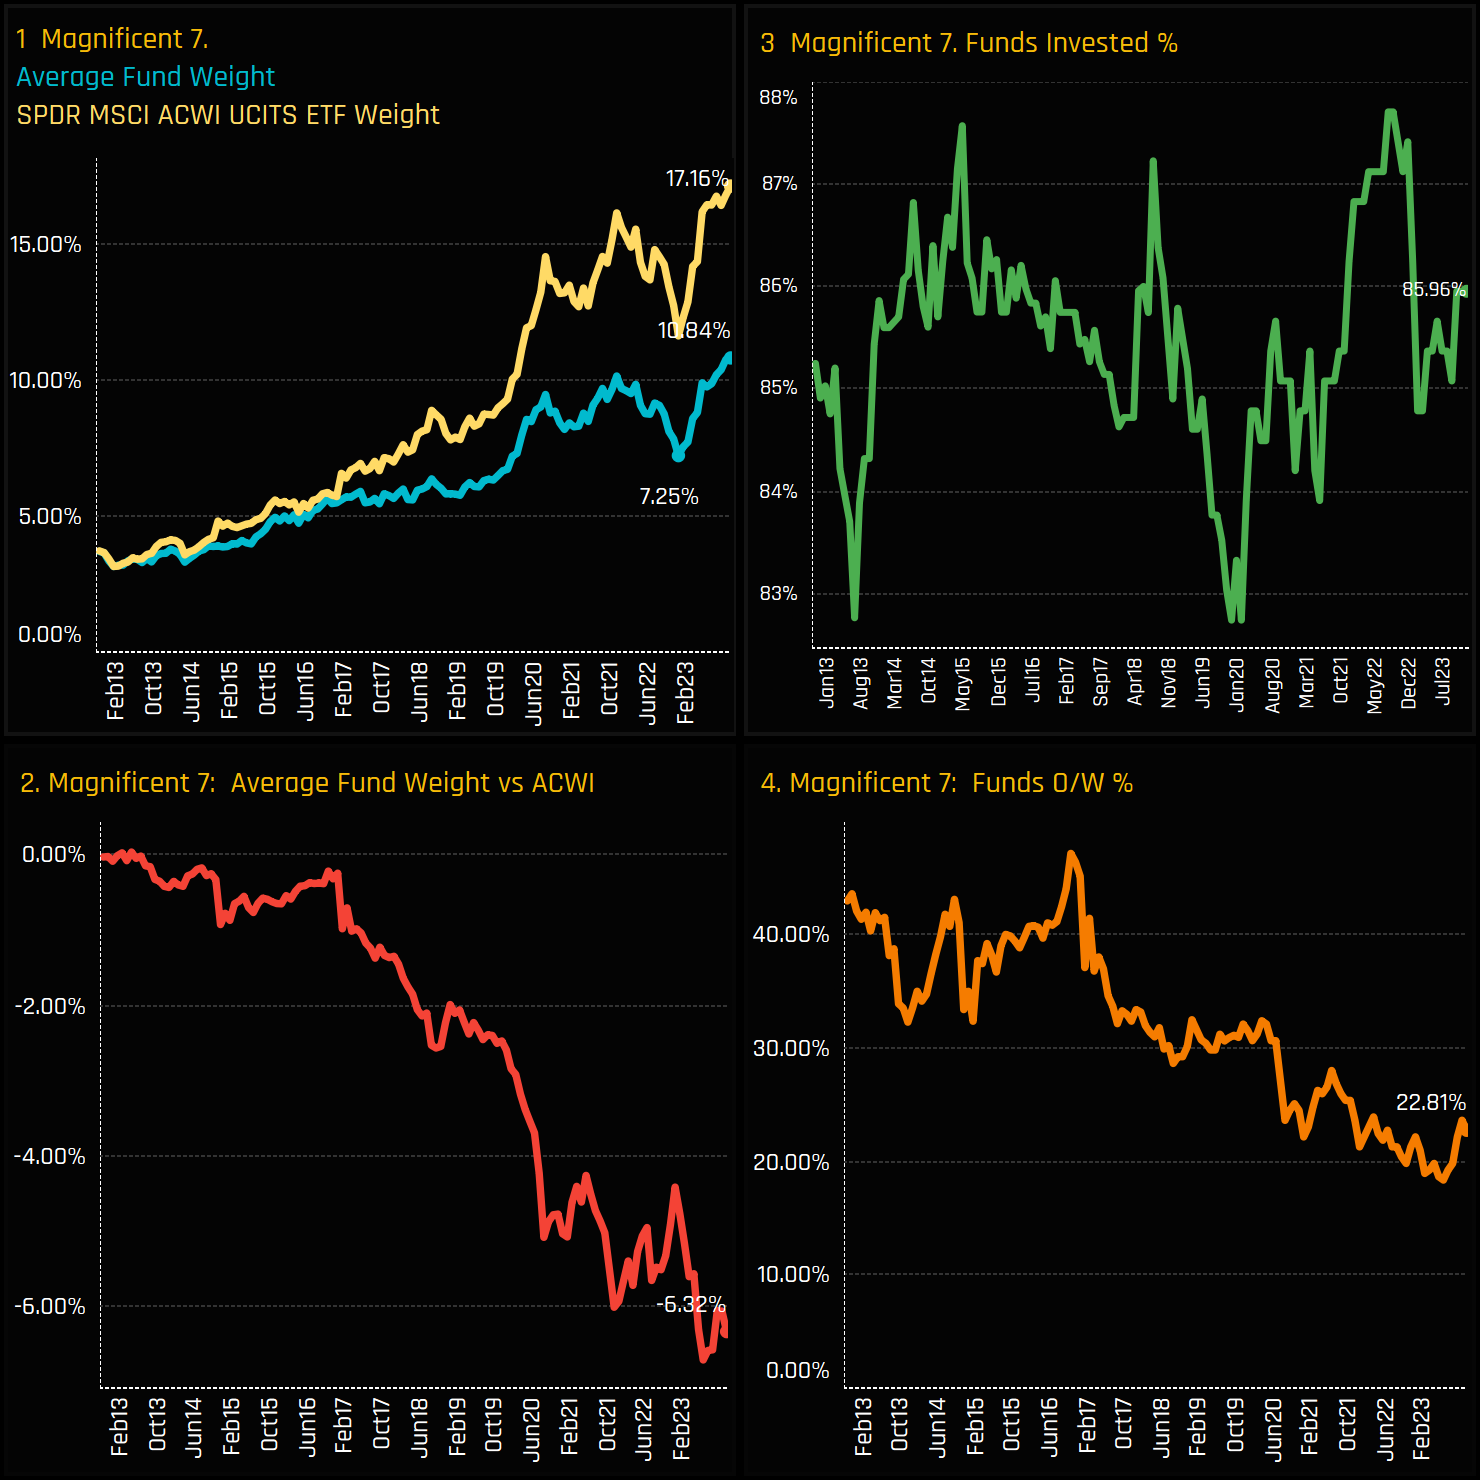
Allocations to the ‘Magnificent 7’ group of stocks in global equity funds have reached record highs. As depicted in Chart 1 opposite, both the average active Global fund and the iShares ACWI ETF have seen a marked increase in allocations following a decline through most of 2022. Despite this uptrend, active funds have not matched the benchmark index’s growing weight, resulting in a near-record underweight position of -6.32% (ch2). And whilst 87% of funds hold at least one of the Magnificent 7 stocks (ch3), only 22.8% maintain an overweight position compared to the ACWI ETF (ch4).
Country Positioning
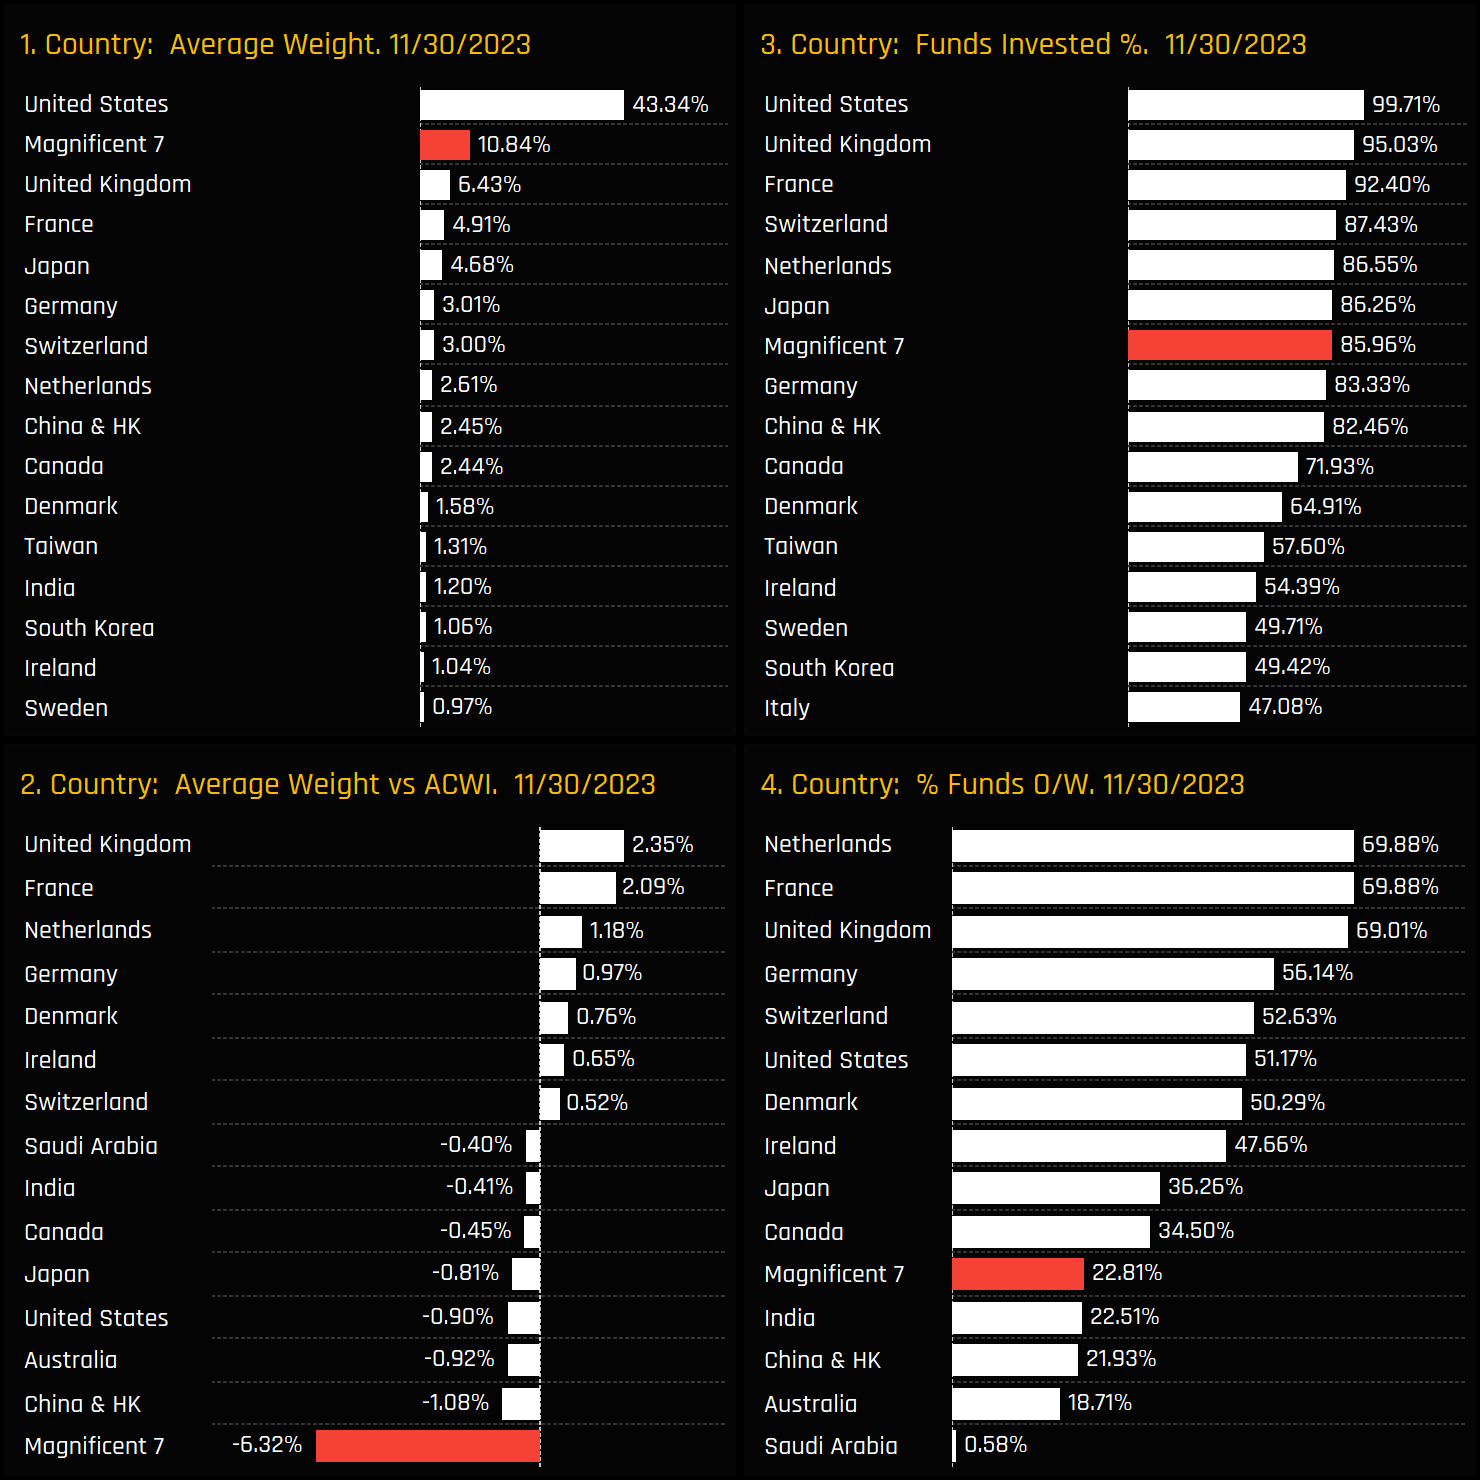
When viewed as a standalone country allocation, these increases have positioned the Magnificent 7 as the second-largest country allocation for Global investors, as depicted in chart 1 to the right. Perhaps the standout metric is the underweight of -6.32% as shown in chart 2, which is well above the underweights of China & HK (-1.1%), Australia (-0.92%) and the rest of the USA (-0.9%). Funds who are underweight the Magnificent 7 are primarily positioning their portfolios overweight in select European countries, with the UK, France, and the Netherlands leading the way.
Fund Style Trends
Positioning Breakdown
Stock Profile: Tesla Inc.
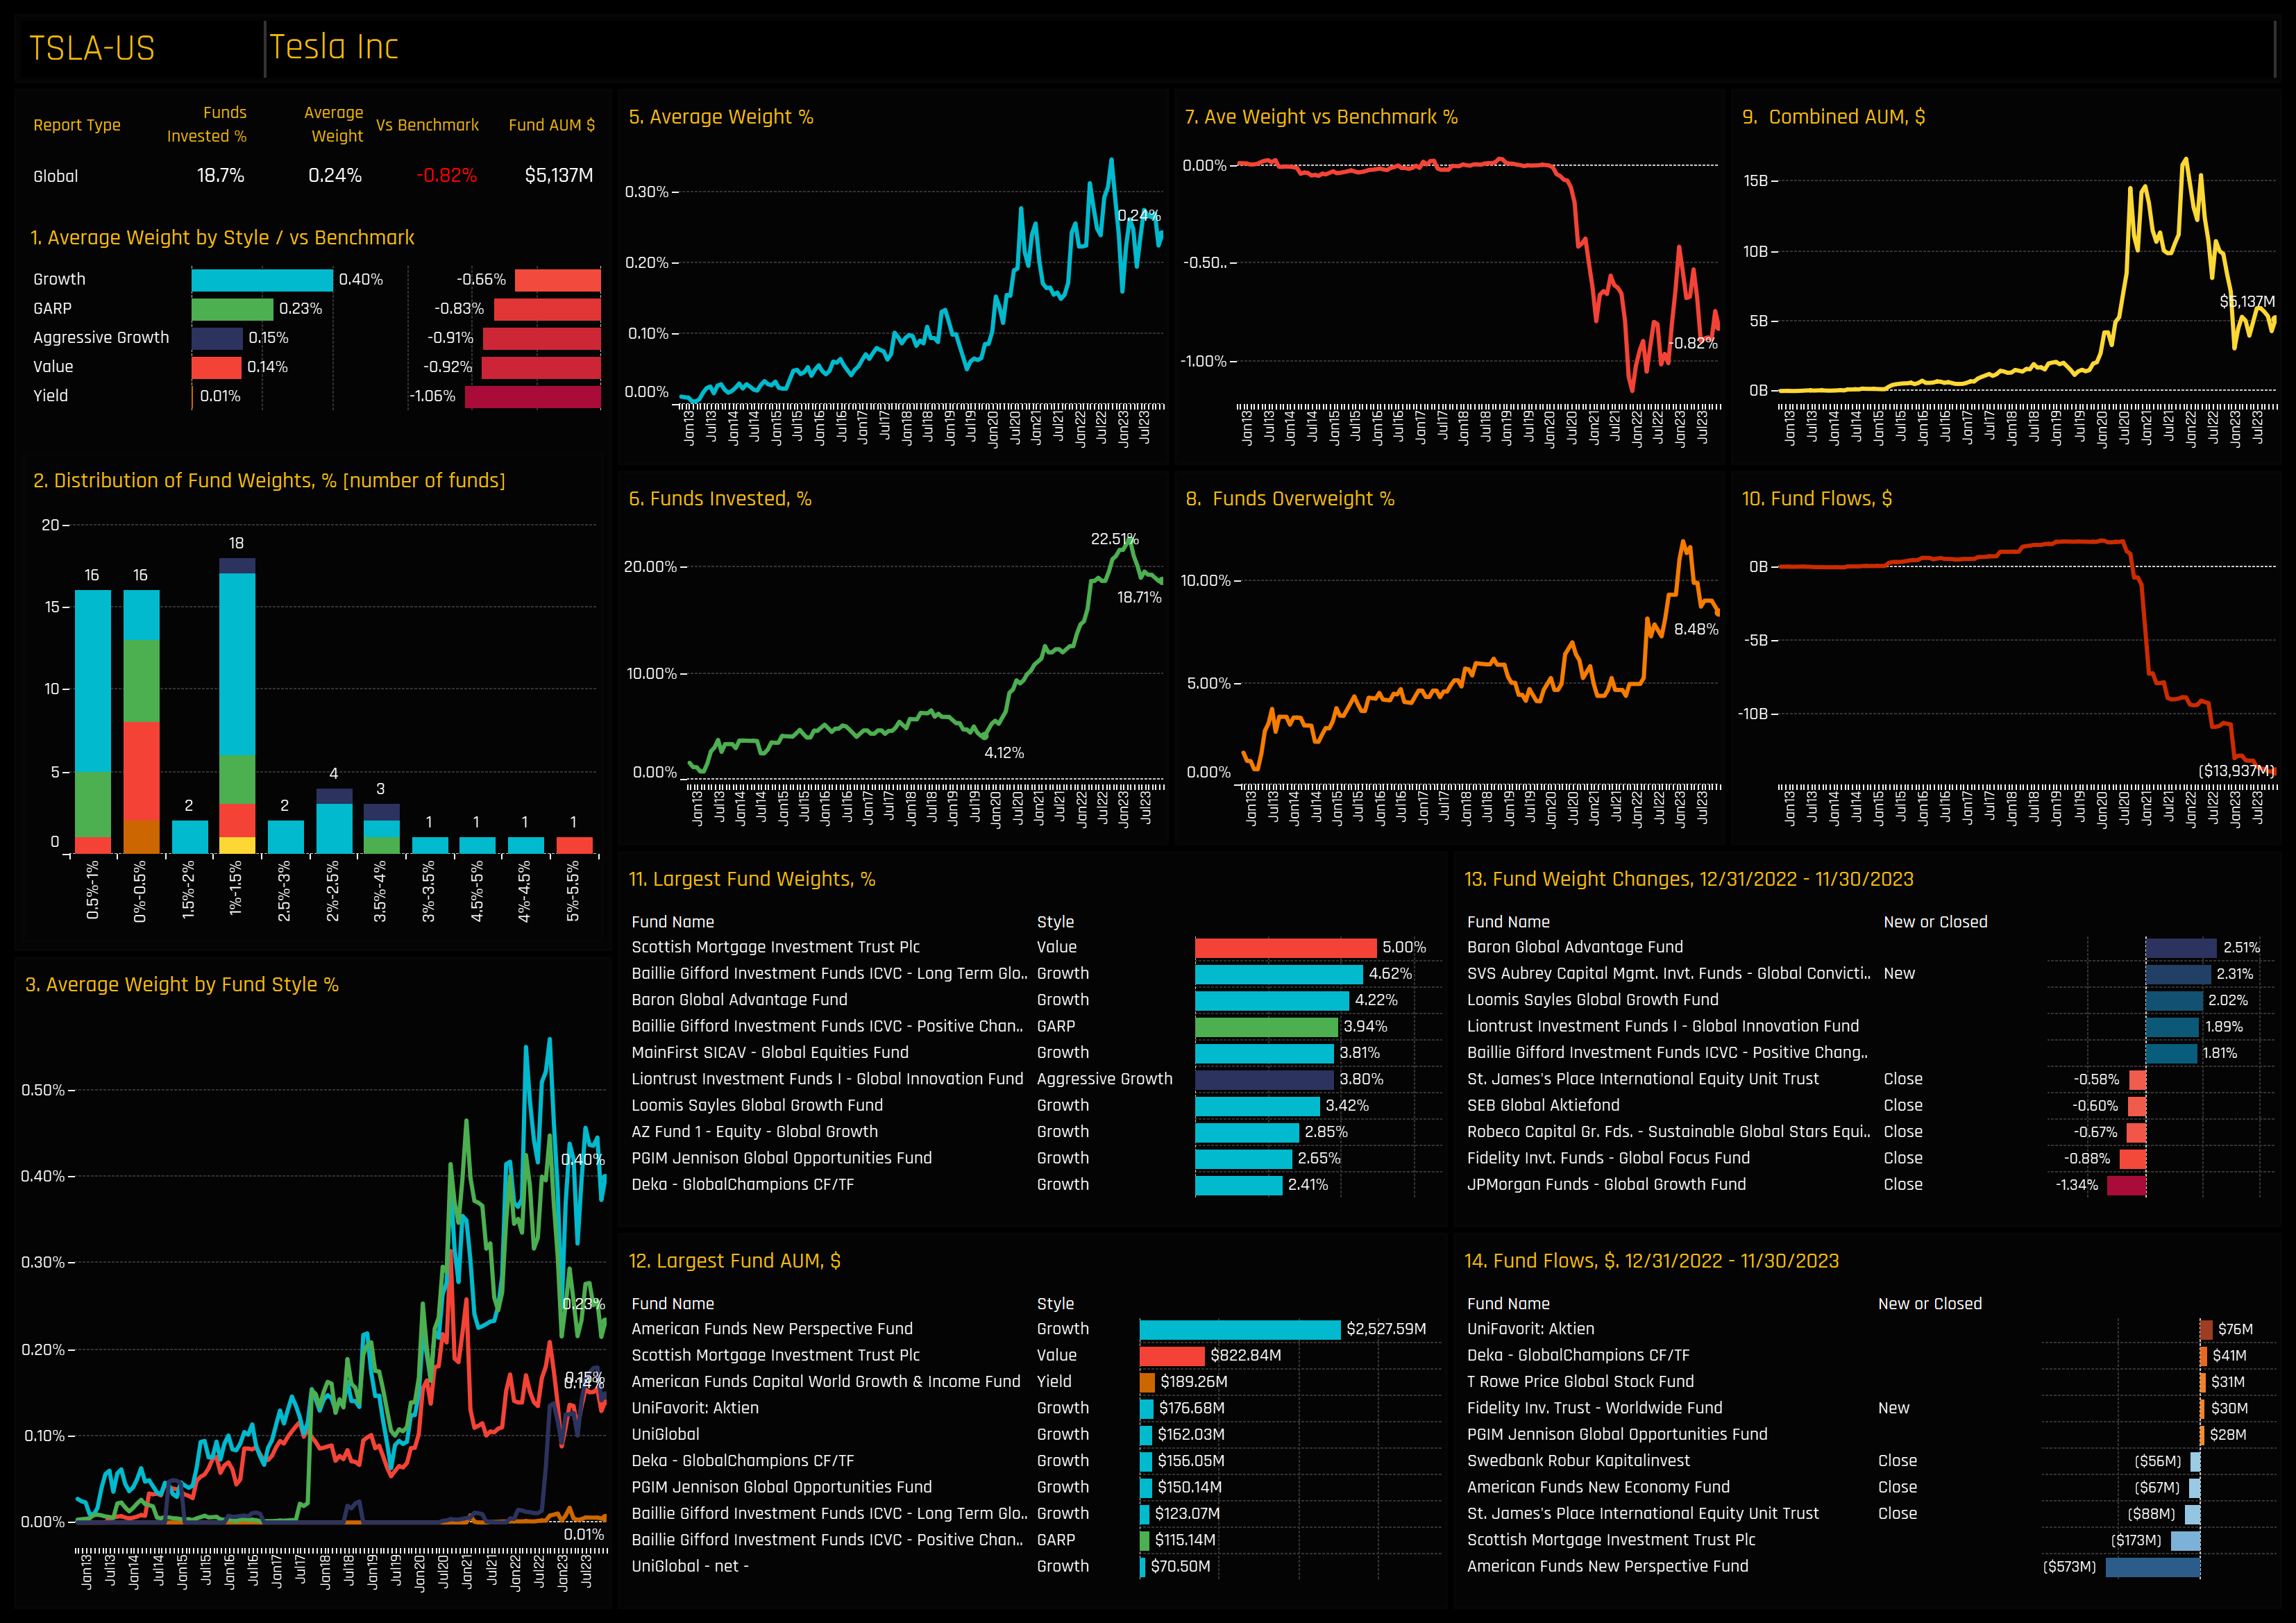
Tesla barely registered among Global funds up until it convincingly broke $20 back in 2020. The ensuing 10x price rally attracted Global investors to the stock, with the percentage of funds invested increasing from 4% to a peak of 22.5% in February of last year, as shown in chart 6. Since then, ownership metrics have declined, with notable outflows from American Funds and Scottish Mortgage, and exits from St James’s Place and Swedbank Robur (Chart 14). Remaining investors are modestly positioned, with the majority of holders below the 1.5% level (chart 2). Early holders Baillie Gifford, Baron Global and Mainfirst top a list of 7 funds with a 3%+ allocation.
Conclusions
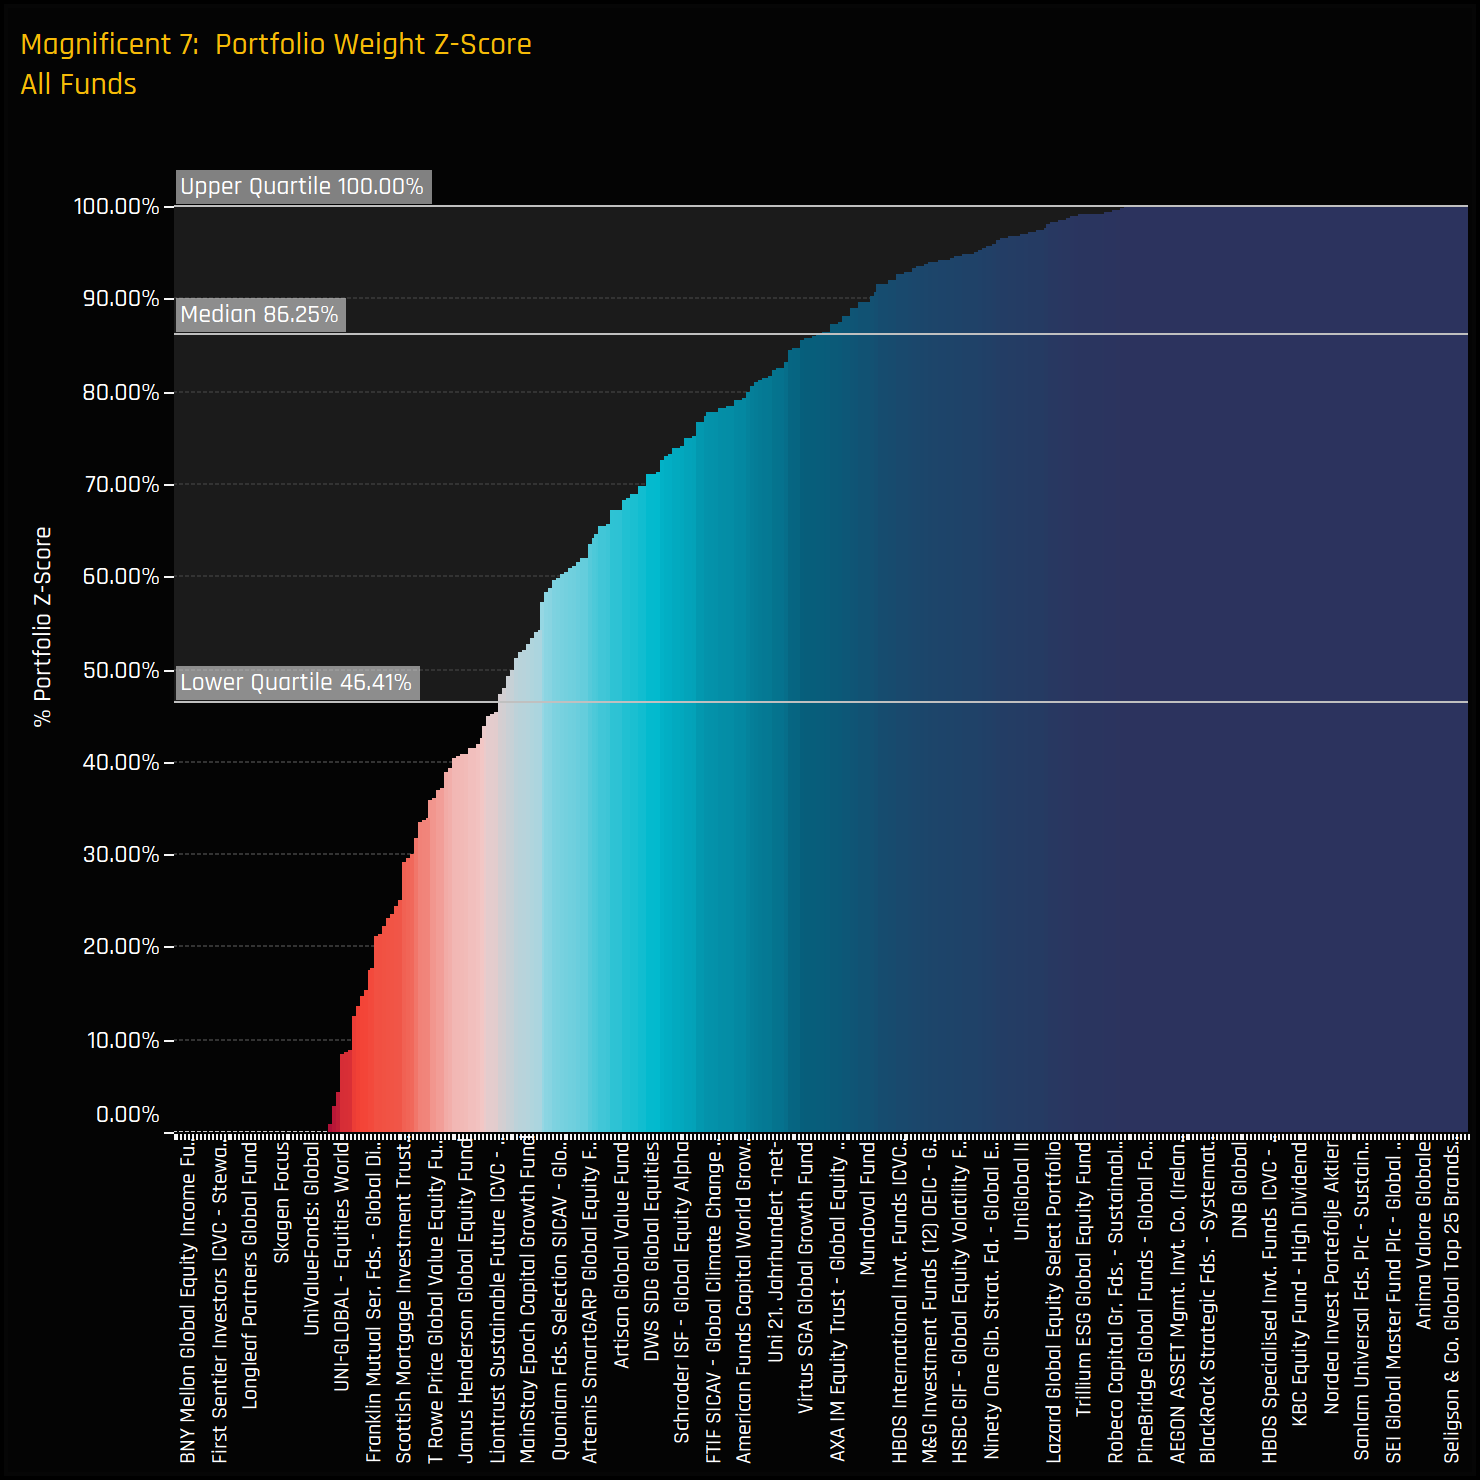
The adjacent chart displays the Z-score of current fund weights in the Magnificent 7 compared to historical data for all current and past holders. Here, a 100% Z-score signifies the highest recorded weight for a fund, while zero represents the lowest. The median Z-score of 86% and a lower quartile at 46.4% underscore the extent to which global managers are heavily positioned in these stocks relative to historical levels.
Collectively, the Magnificent 7 now constitute a significant portion of global fund allocations, effectively ranking as the second-largest country allocation and contributing substantially to the increasing underweight in the USA. Valuations clearly pose a challenge, particularly for funds at the Value end of the spectrum, so sustained growth will be needed to meet the expectations of the more heavily invested Growth-oriented funds in our analysis.
However, as our analysis shows, grouping these stocks together doesn’t fully capture the nuances of their individual ownership profiles. Microsoft’s dominance is clear, NVIDIA has attracted a new wave of investors this year, whilst Tesla has struggled to gain the same level of trust from active Global investors. This diversity in ownership and sentiment highlights the importance of considering each stock on its own merits, rather than as one homogeneous group.
In the full report, we look in more detail at individual fund allocations and activity in the Magnificent 7 group of stocks, and provide detailed profiles of each company. If you are a financial professional and would like to see the full report as part of a trial, please get in touch directly on the email below.
Taken from our Global Equity Fund positioning analysis, covering 342 active strategies with a combined AUM of $990bn.
Related Posts

- Steve Holden
- March 22, 2023
Global Stock Radar
356 Global Equity Funds, AUM $938bn Global Funds: Stock Radar Investment levels among the thous ..

- Steve Holden
- January 29, 2023
Global Funds: Record Under-Allocation in Emerging Markets
358 Global Equity Funds, AUM $914bn Record Under-Allocation in Emerging Markets Exploring the F ..

- Steve Holden
- February 20, 2023
Consensus Overweight in UK Stocks
358 Global Equity Funds, AUM $914bn Overweight Consensus in UK Stocks A record 70.4% of Global ..

