Active Asia Ex-Japan Funds: Performance & Attribution Q1 2026
April 30th 2026
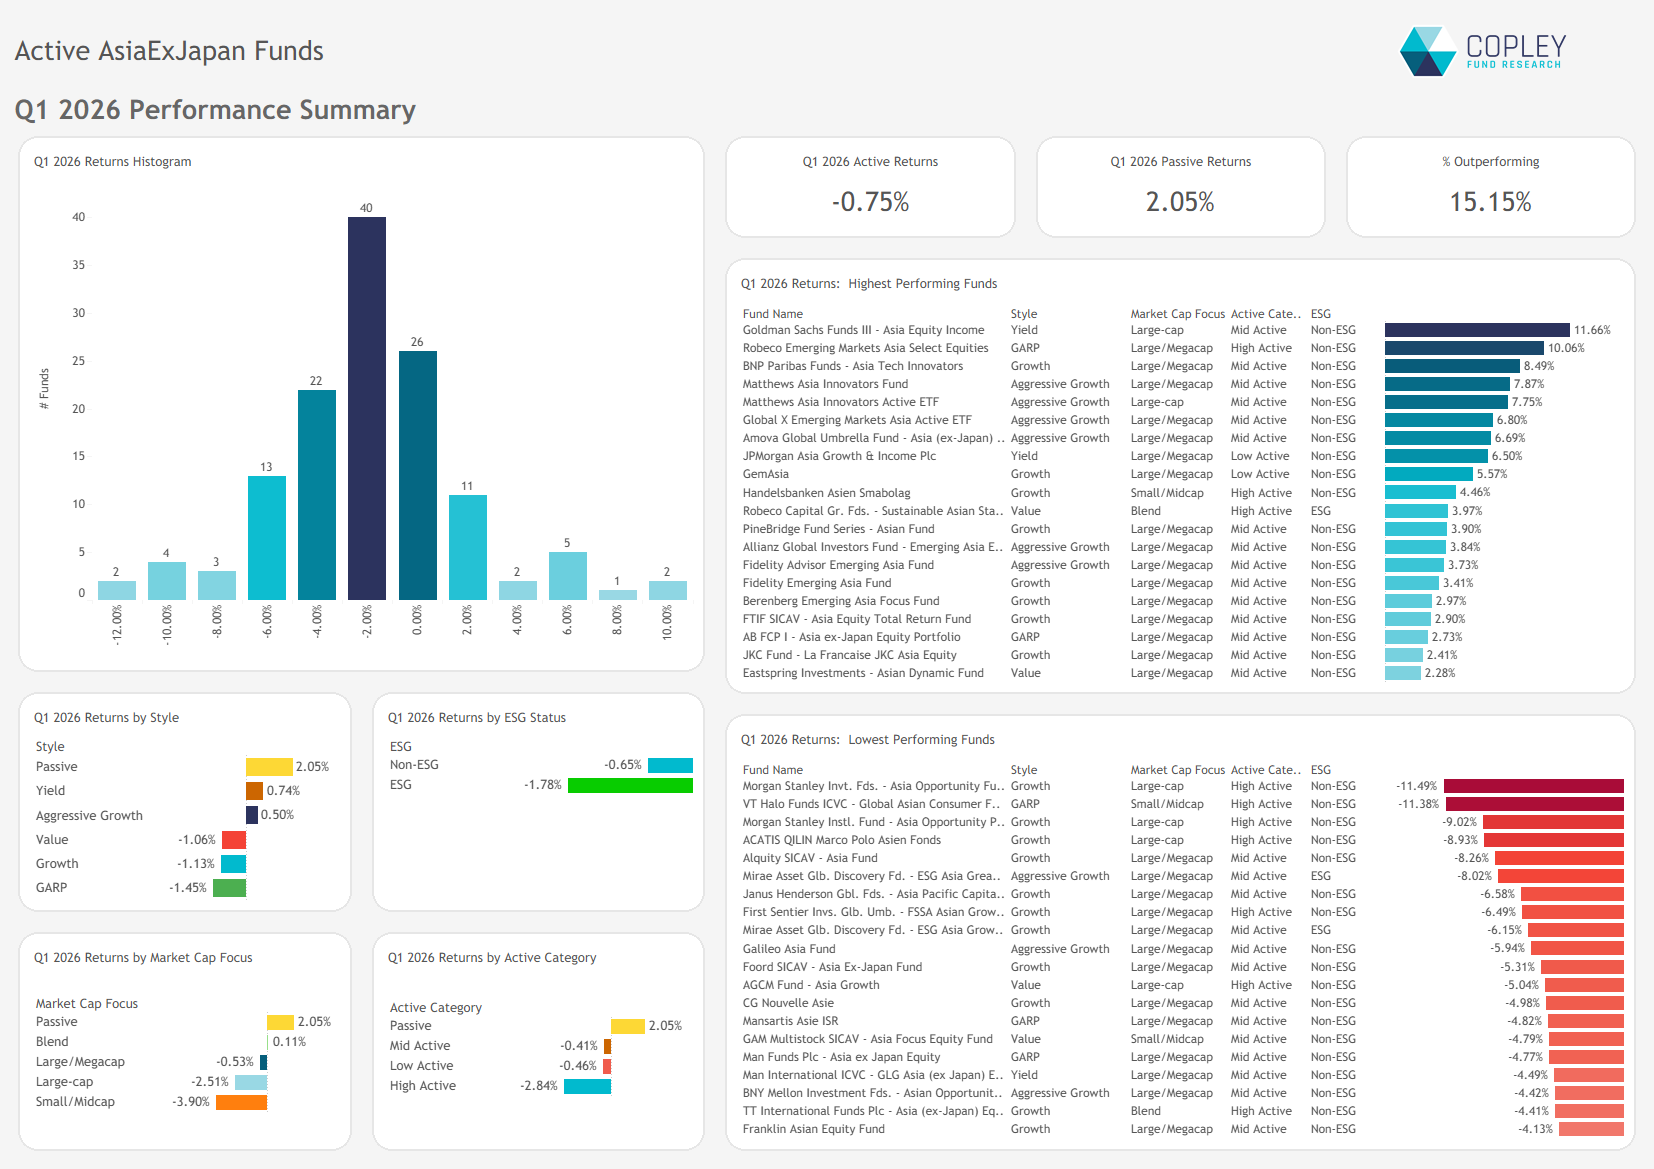
Active Asia ex-Japan funds fell -0.75% in Q1, but the iShares MSCI All Country Asia ex Japan ETF rose +2.05% due to systematic fair value pricing, versus -1.2% for the underlying index.
Narrow leadership, broader weakness: Gains were concentrated in Korea/Taiwan Technology and a handful of stocks, while China and India exposures dragged on overall returns.
Positioning mattered, but gaps remain: Overweights in Korean Tech helped, but underweights in TSMC and China/India positioning drove underperformance, leaving managers still playing catch-up after 2022–2025.
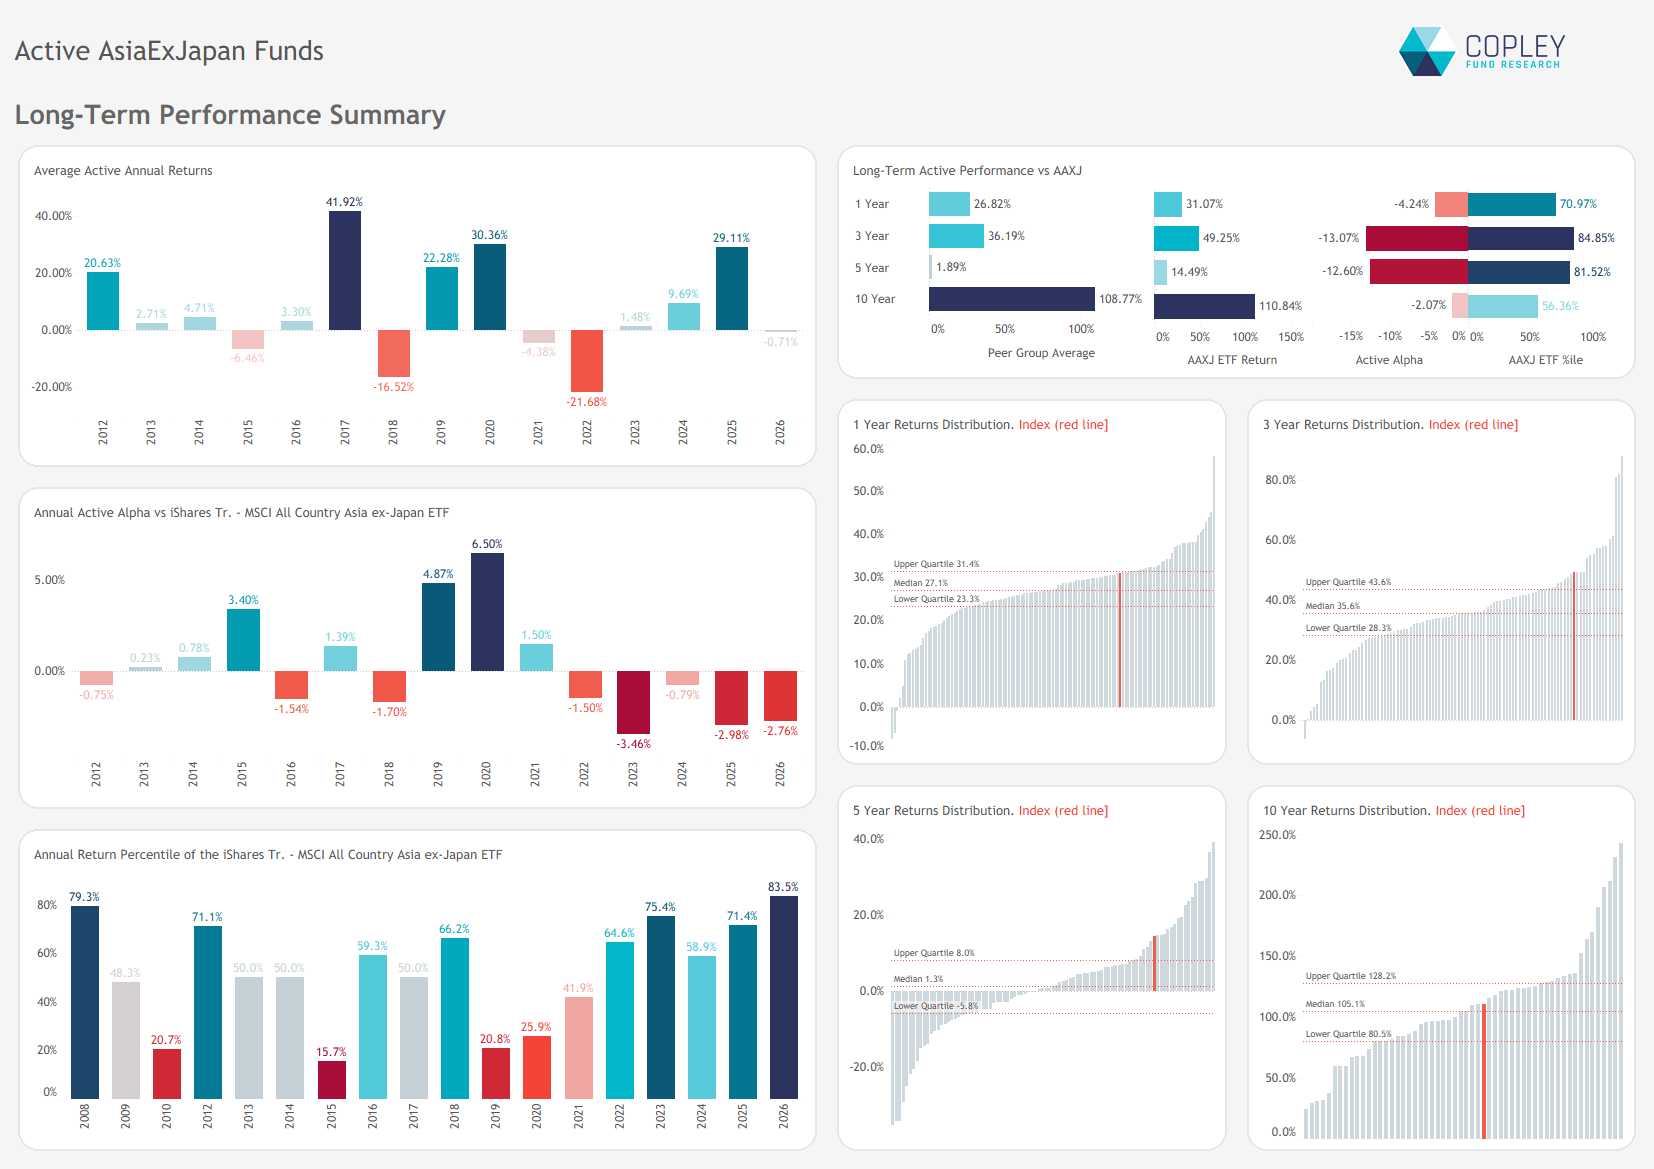
Flat on the Quarter Active Asia ex-Japan funds returned -0.75% over the quarter, with a wide dispersion: top performers delivered double-digit gains while laggards posted double-digit losses. The most common outcome sat in the -2% to 0% range.
The iShares MSCI All Country Asia ex Japan ETF returned +2.05%, a figure flattered by its use of “systematic fair value” pricing. Unlike most funds, which rely on local market closing prices, the ETF adjusts valuations post-close to reflect US market moves. On a like-for-like basis, the underlying benchmark index declined -1.2% over the quarter.
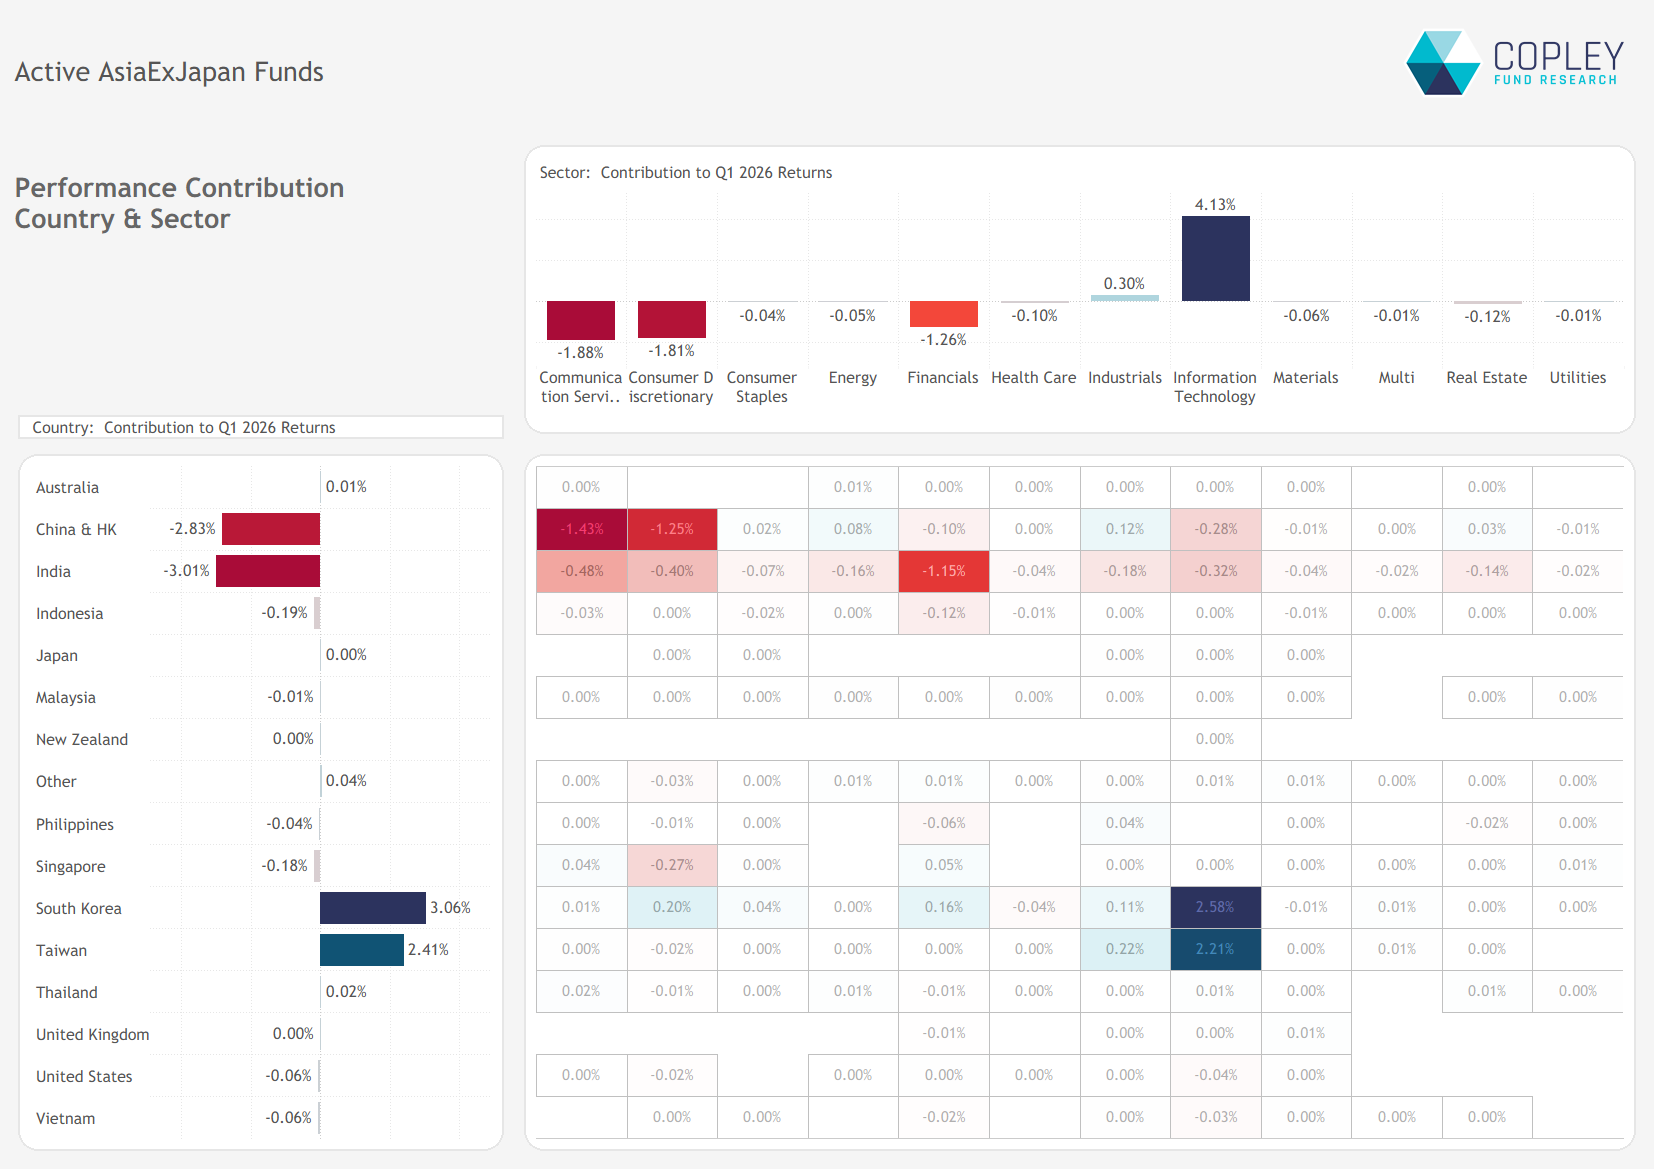
Regional Split The charts below break down Q1 return drivers by country and sector, based on aggregate manager holdings. At the sector level, Technology was the standout contributor, adding 4.1% to returns, but this was more than offset by weakness across Consumer Discretionary, Consumer Staples and Financials.
At the country level, Taiwan and South Korea were the only clear contributors, with gains outweighed by declines in China and India. Within South Korea, performance was driven not just by Technology, but also by contributions from Industrials, Financials and Consumer Discretionary.
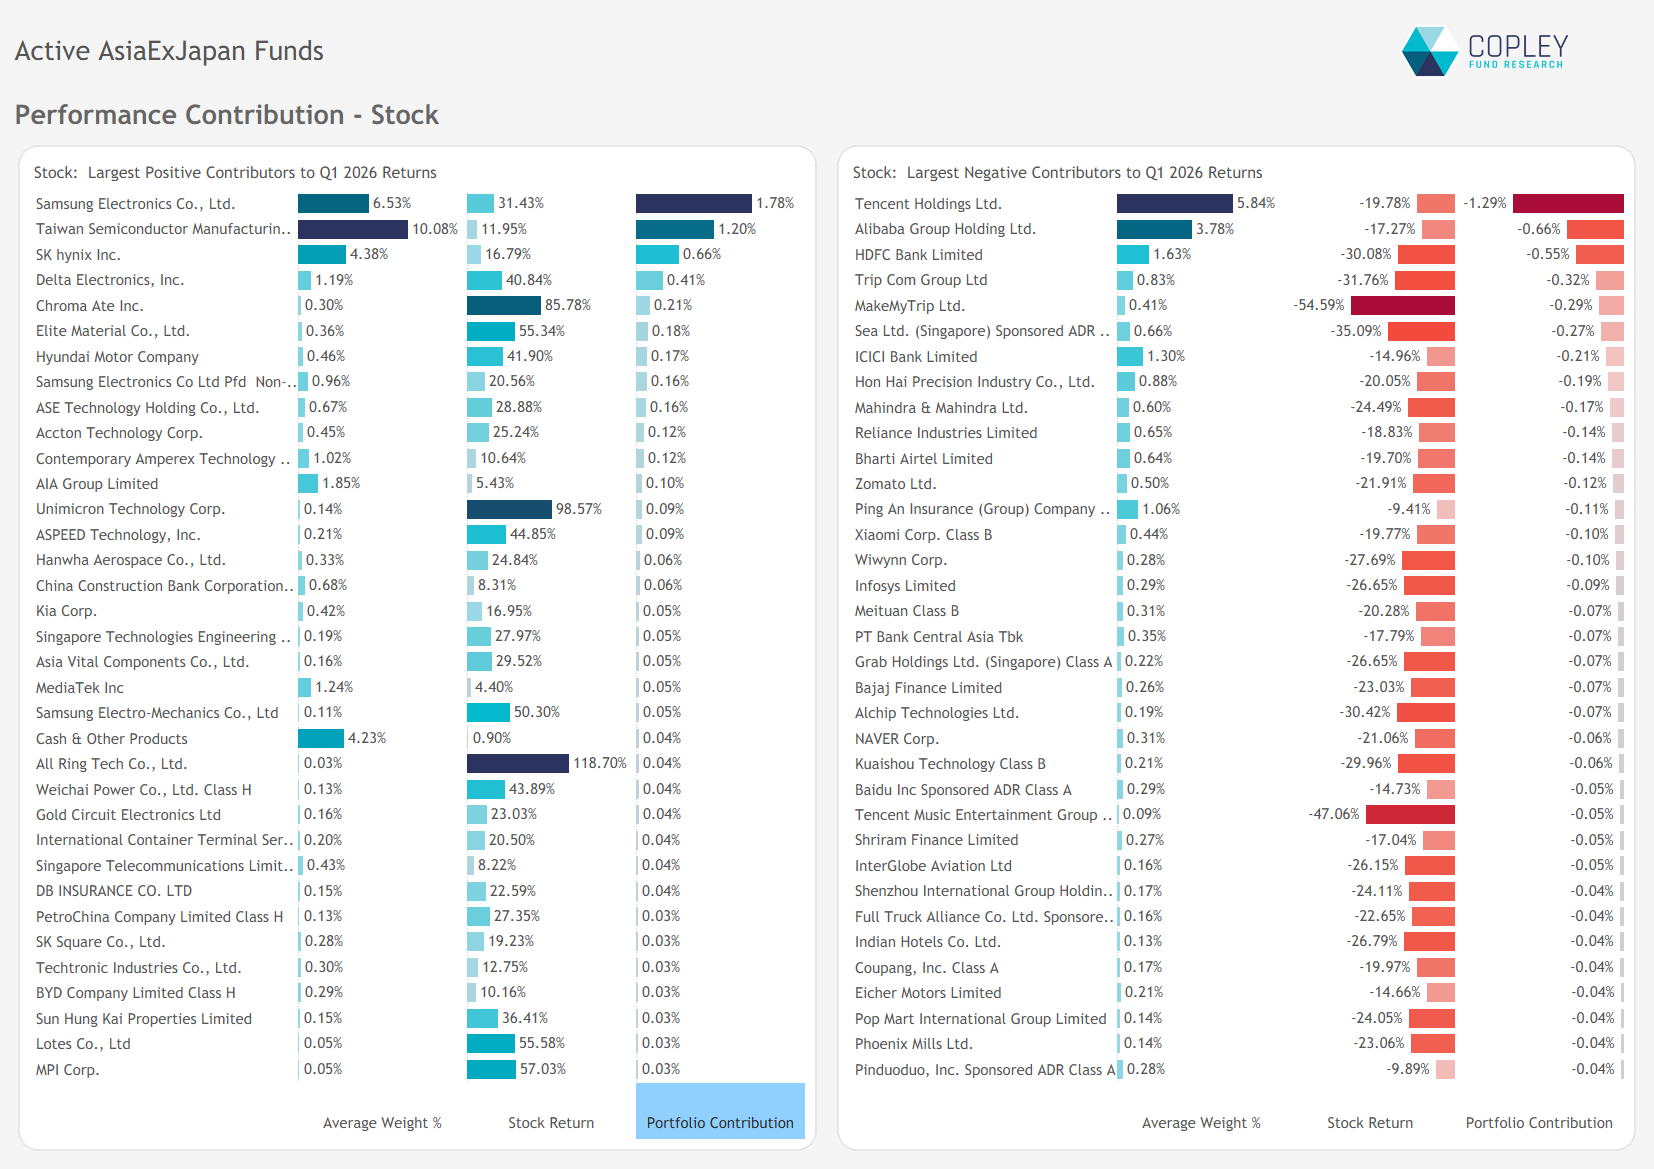
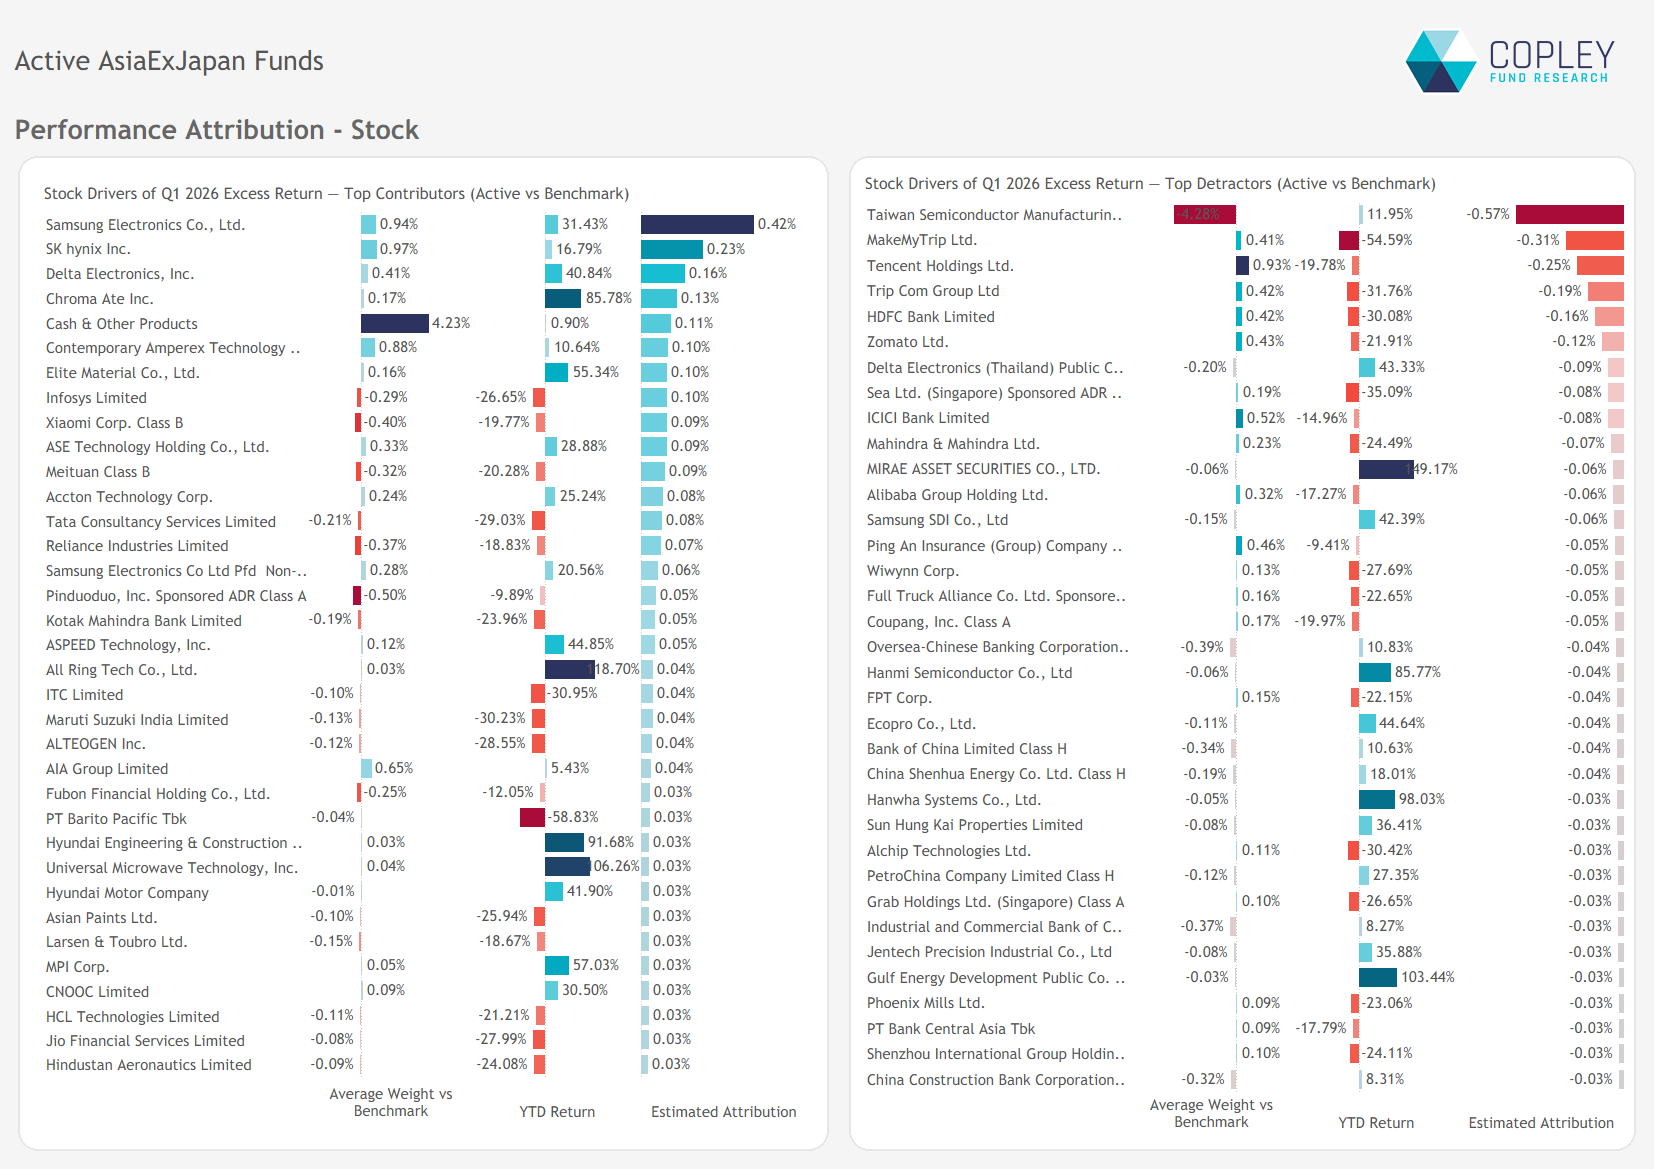
Stock-Level Influence At the stock level, gains were highly concentrated in four key names. Taiwan Semiconductor Manufacturing Company, Samsung Electronics, SK Hynix and Delta Electronics were the primary contributors, adding over 4% to total Q1 returns.
However, these gains were overwhelmed by weakness in core China and India positions. Tencent, Alibaba Group and HDFC Bank detracted a combined 2.5% on average, with further losses from positions in Trip.com Group, MakeMyTrip and Sea Limited.
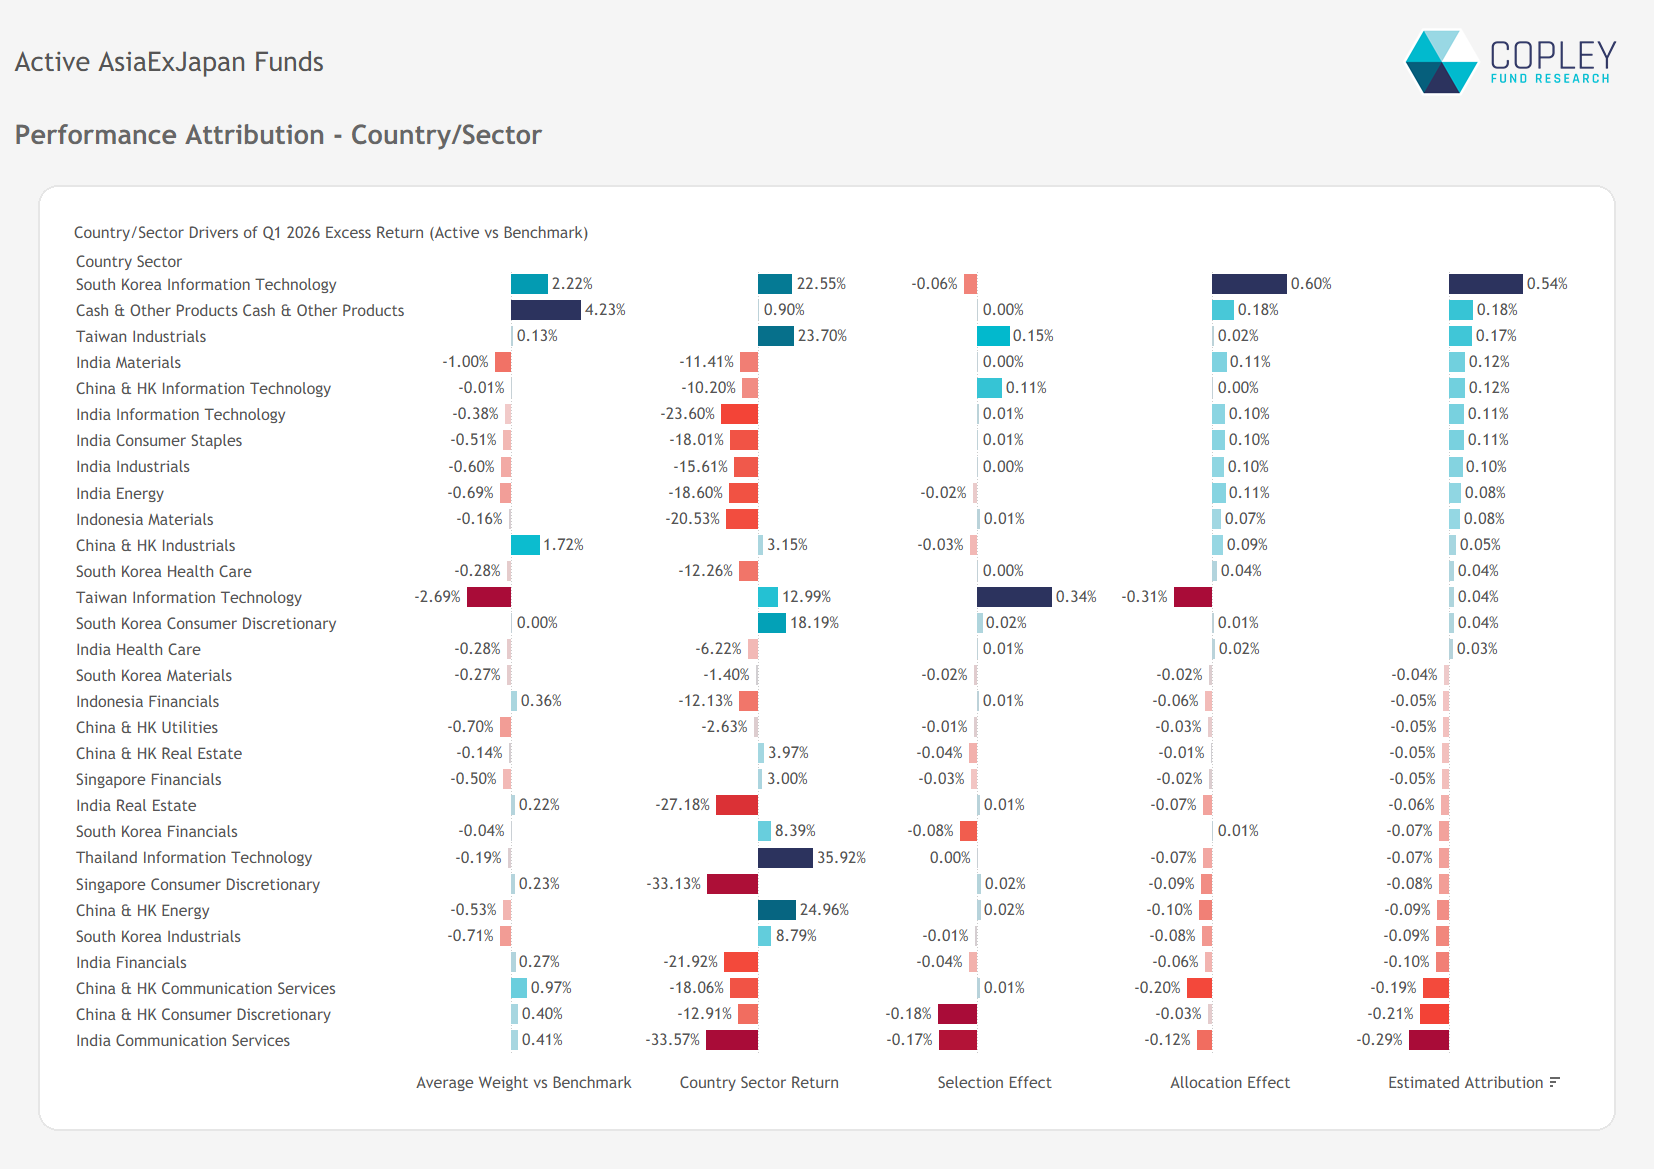
Performance Attribution – Where Funds made and lost versus the Benchmark The chart below breaks down the key drivers of relative performance at the country/sector level. Outperformance was led by overweights to South Korea Technology, cash holdings, and strong stock selection in Taiwan Industrials and China Technology.
On the flip side, underperformance was driven by overweights in China and India Communication Services, alongside weak stock selection in China Consumer Discretionary.
Stock Attribution Active EM managers benefited from net overweights in Samsung Electronics, SK Hynix and Delta Electronics, while underweights in Xiaomi and Infosys also supported relative performance.
On the negative side, the UCITS-driven underweight in Taiwan Semiconductor Manufacturing Company was a key drag, alongside overweights in MakeMyTrip, Tencent and Trip.com Group.
Long-Term Performance With the inflated returns of the iShares MSCI All Country Asia ex Japan ETF — driven by its use of systematic fair value pricing — active returns appear weaker than they should, creating what is effectively a short-term distortion rather than a true performance gap.
That said, managers still need to close the gap, with underperformance over 2022–2025 leaving little room for complacency.
Performance & Attribution Report
Click the link opposite for full charts and data detailing the drivers of Q1 2026 performance, along with a review of 3-, 5-, and 10-year results across the active Asia Ex-Japan peer group.
Investor Positioning Report — Copley Fund Research Ltd · Last updated: July 2026 · Registered in England and Wales
1. Who we are
Copley Fund Research Ltd provides proprietary institutional fund intelligence to listed companies and investor relations professionals. These terms govern every purchase of an Investor Positioning Report. By completing a purchase you confirm you have read, understood, and agreed to these terms in full.
2. What you are purchasing
The Investor Positioning Report is a bespoke PDF report mapping the institutional fund universe around your stock. It covers current investors, past investors, competitor investors, and white space investors. Every report is built from scratch for the specific company ordered and is not a standardised or templated product.
3. Delivery and process
Following payment or invoice issuance, Copley Fund Research will contact you within one working day to agree your competitor set. Production begins once the competitor set is confirmed in writing. The completed report will be released to you within 48 hours of production starting, provided payment has been received in full; where payment is outstanding, the report will be withheld until payment clears. If the requested company falls outside our covered fund universes, or a competitor set cannot be agreed, Copley Fund Research will issue a full refund or cancel the outstanding invoice.
4. Competitor set agreement
The competitor set is agreed with you in writing prior to production, and the report is built to that agreed specification. Requests to amend the competitor set after delivery, based on a change of preference rather than an error, may be treated as a new order.
5. Refund policy
Because each report is produced individually for your company, orders are non-refundable once production has begun, except as set out in clauses 3 and 5a below. By purchasing, you agree not to dispute the charge with your card provider on the basis that the service was not as described, provided the report has been delivered to the agreed specification or corrected under clause 5a.
5a. Quality remedy
If a delivered report contains a material error caused by Copley Fund Research — for example, an incorrect company analysed, a competitor omitted from the agreed set, or content missing from the specification in clause 2 — Copley Fund Research will correct and redeliver the report at no additional charge, within a reasonable timeframe. This is your sole remedy for such errors.
6. Data and accuracy
All fund positioning data in the report reflects holdings as disclosed at the most recently available reporting date at the time of compilation. The timing of fund holdings disclosures is determined by regulatory requirements applicable to each fund and is outside the control of Copley Fund Research Ltd. This data may not reflect current fund positions. Copley Fund Research takes reasonable care to ensure accuracy but makes no warranty, express or implied, as to the completeness or current accuracy of the underlying data — though this does not affect the quality remedy in clause 5a for errors in how that data was analysed or presented. Past fund positioning is not indicative of future fund behaviour or investment decisions.
7. Not investment advice
The Investor Positioning Report is produced for investor relations intelligence purposes only. It does not constitute investment advice, financial advice, or a recommendation to buy, hold, or sell any security. The data reflects historical fund positioning and must not be relied upon as a prediction of future fund behaviour or investment decisions. Copley Fund Research Ltd is not authorised or regulated by the Financial Conduct Authority for the provision of investment advice.
8. Permitted use and confidentiality
The report is licensed for internal use by the purchasing organisation only. You may share it with employees and directors of your organisation. You may not: reproduce, redistribute, publish, or resell the report or any part of it; share it with any third party outside your organisation without prior written consent; use the fund or portfolio manager names contained in the report to approach those individuals on behalf of Copley Fund Research or in a manner that could damage Copley Fund Research's relationships with those funds; or use the data for any purpose other than your own investor relations strategy. The data, analysis, and methodology contained in the report are the intellectual property of Copley


