Active Asia Ex-Japan Funds: Q3 2026 Performance & Attribution
- Steve Holden
- 0 Comments
Active Asia Ex-Japan Funds: Q3 2026 Performance & Attribution
Korean and Taiwanese semiconductors delivered more than the entire return, but cash and the Taiwan underweight left active Asia ex-Japan funds 0.75% behind the index
23 October 2026 · Steven Holden · Data to 30 September 2026
Small majority beat the index, but the average did not
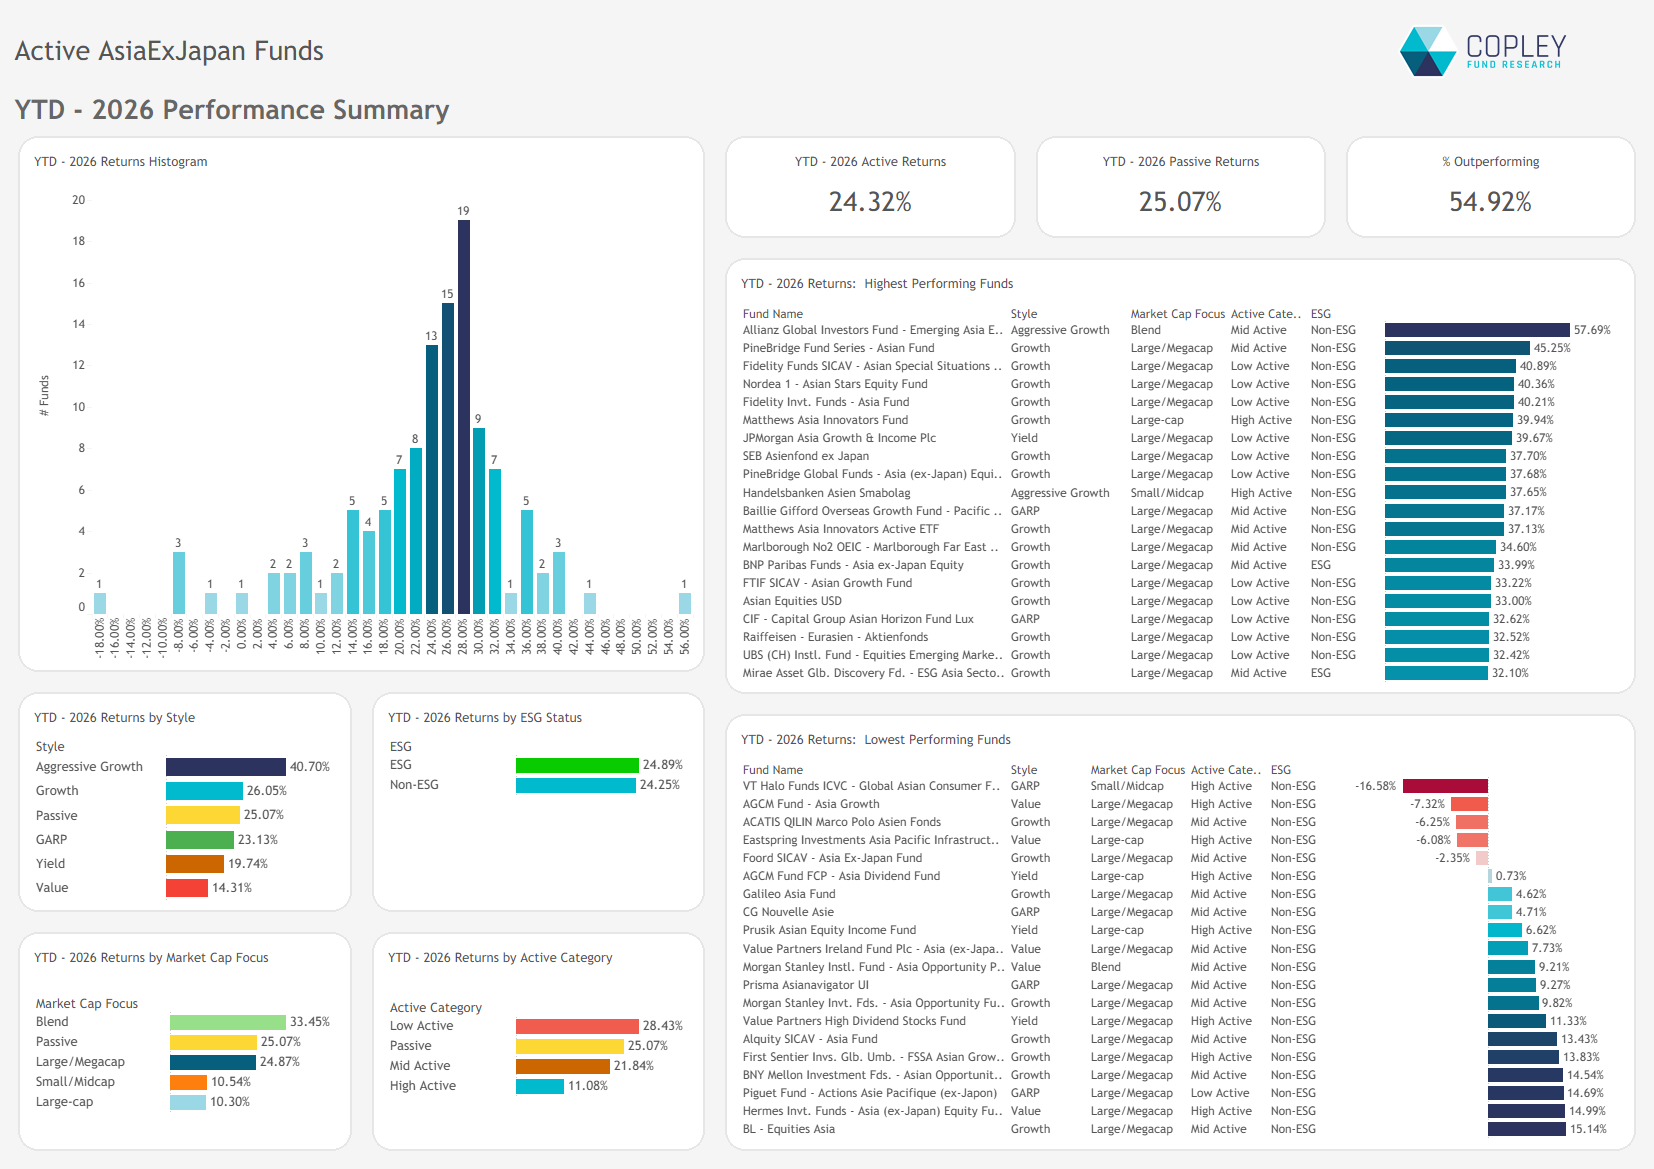
The average active Asia ex-Japan fund returned 24.32% in the first nine months of 2026, against 25.07% for the iShares MSCI All Country Asia ex-Japan ETF (AAXJ), an average alpha of -0.75%. The headline understates how many managers did well: 54.92% of funds beat the index, and the median fund return of 26.6% was ahead of it. A small number of weak funds pulled the average below the benchmark.
This note breaks down the returns of 159 active Asia ex-Japan funds. It shows where managers won and lost against the benchmark, and which fund types came out ahead. Headline returns are based on actual fund returns; the contribution and attribution figures are estimated from each fund’s monthly holdings filings, so the two are close but will not match exactly.
Korea and Taiwan delivered more than the entire return
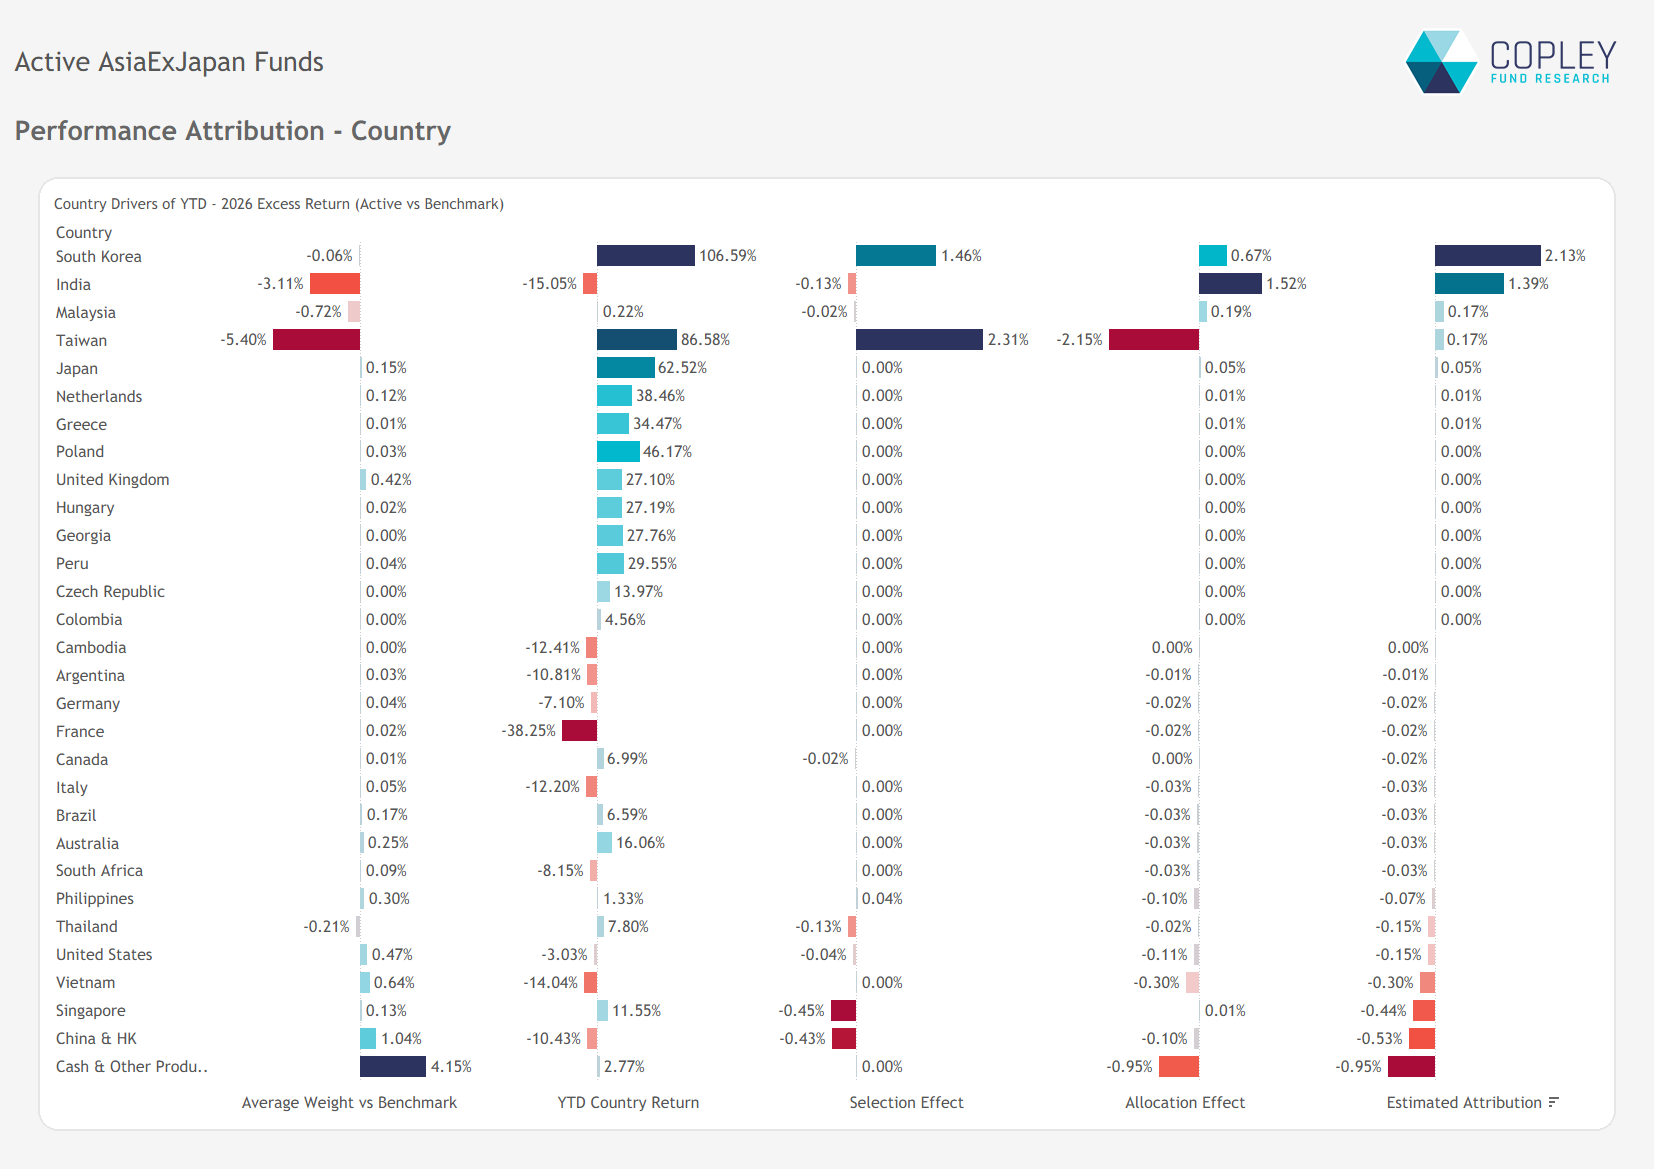
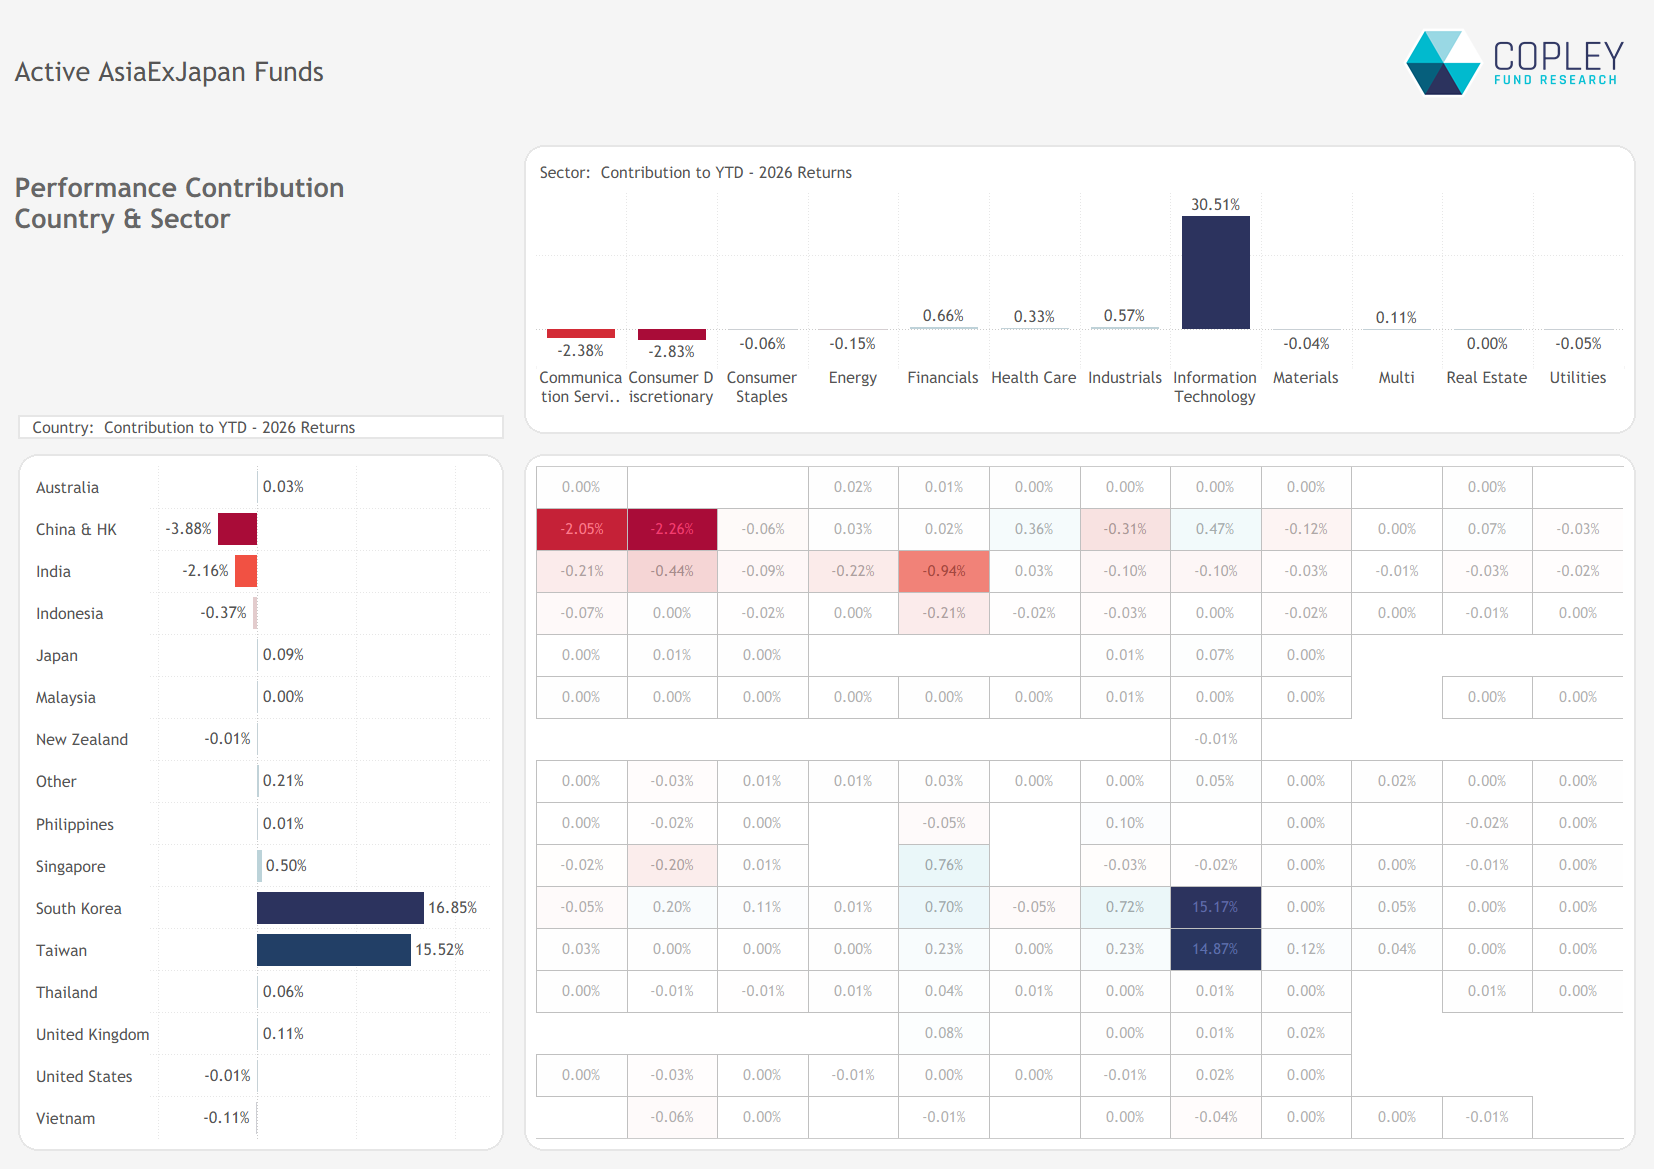
South Korea added 16.85% to the average fund return and Taiwan 15.52%. Together these two markets added 32.37%, more than the average fund’s entire return. China & HK (-3.88%) and India (-2.16%) were the biggest detractors, followed by Indonesia (-0.37%). Singapore (+0.50%) was the strongest of the remaining markets.
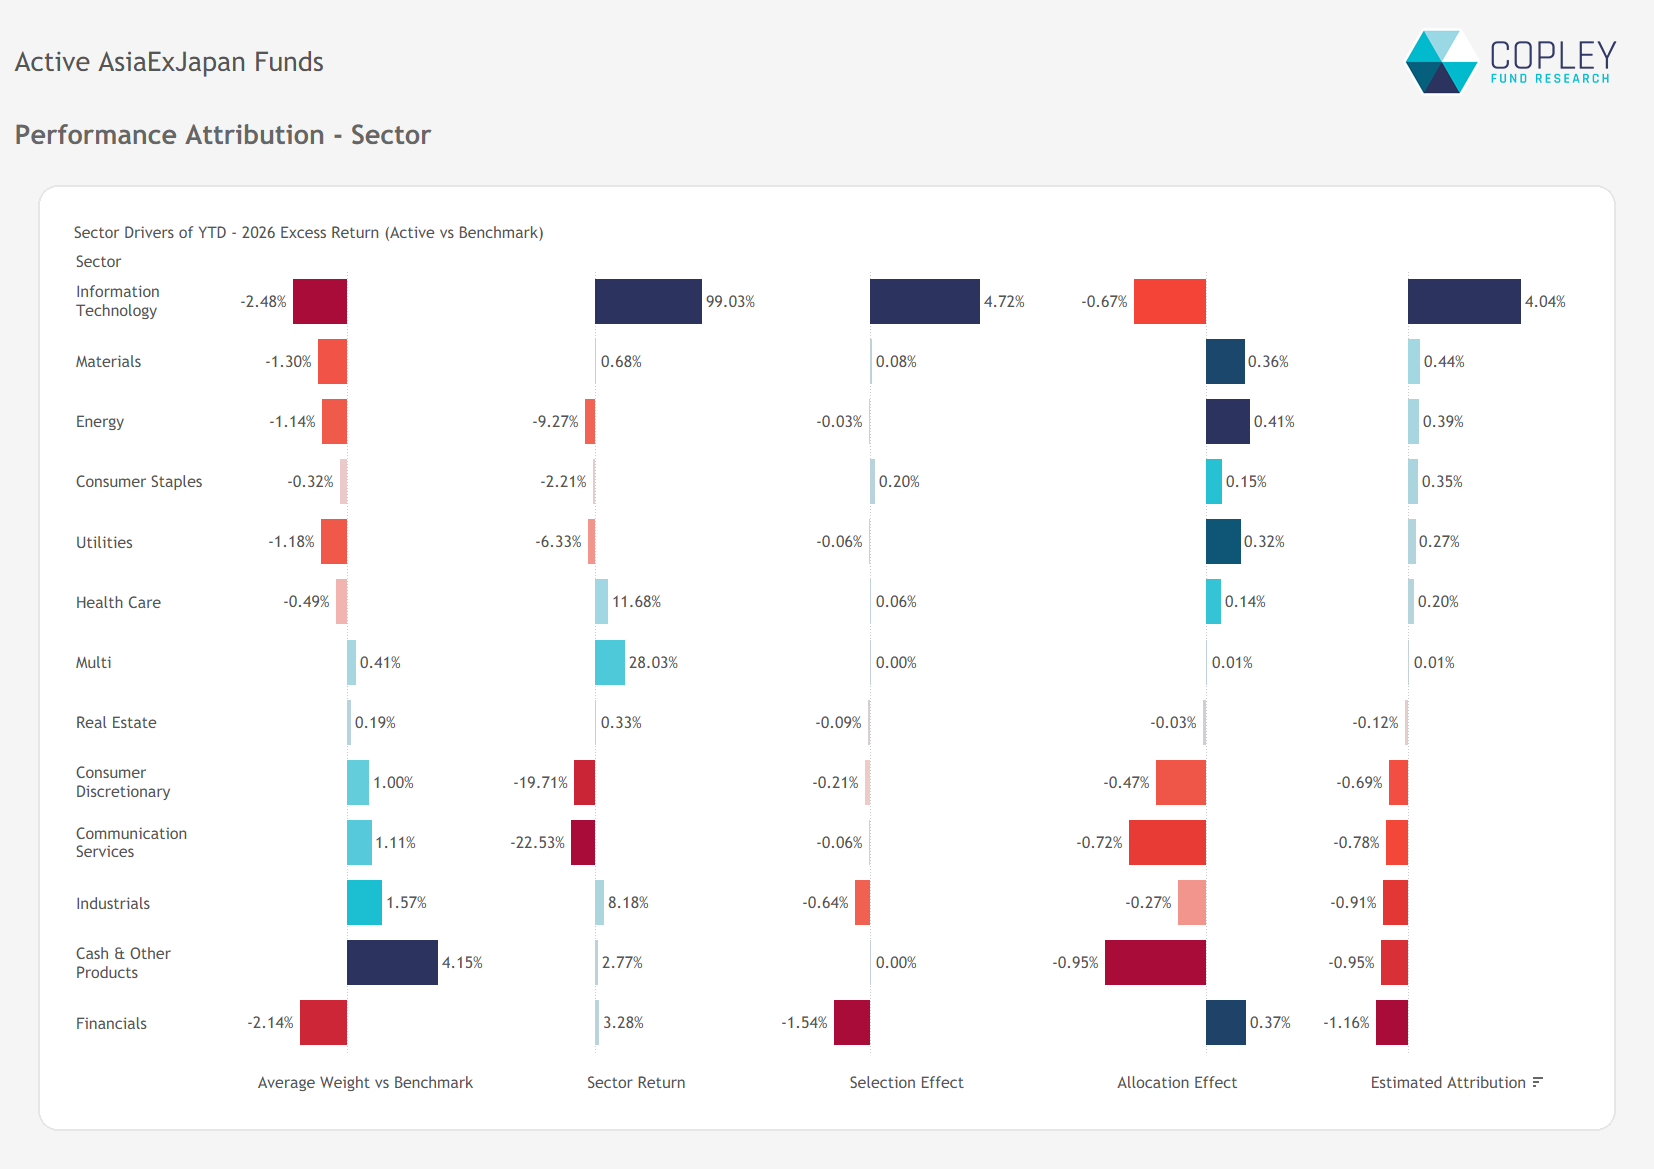
The sector view tells the same story, with IT contributing 30.51% to total returns. Almost all of that came from two country/sector pairs: Korean IT (+15.17%) and Taiwanese IT (+14.87%). Strip Technology out and the average Asia ex-Japan fund is down on the year. Consumer Discretionary (-2.83%) and Communication Services (-2.38%) were the largest sector detractors, almost entirely from China.
Three semiconductor stocks did three-quarters of the work
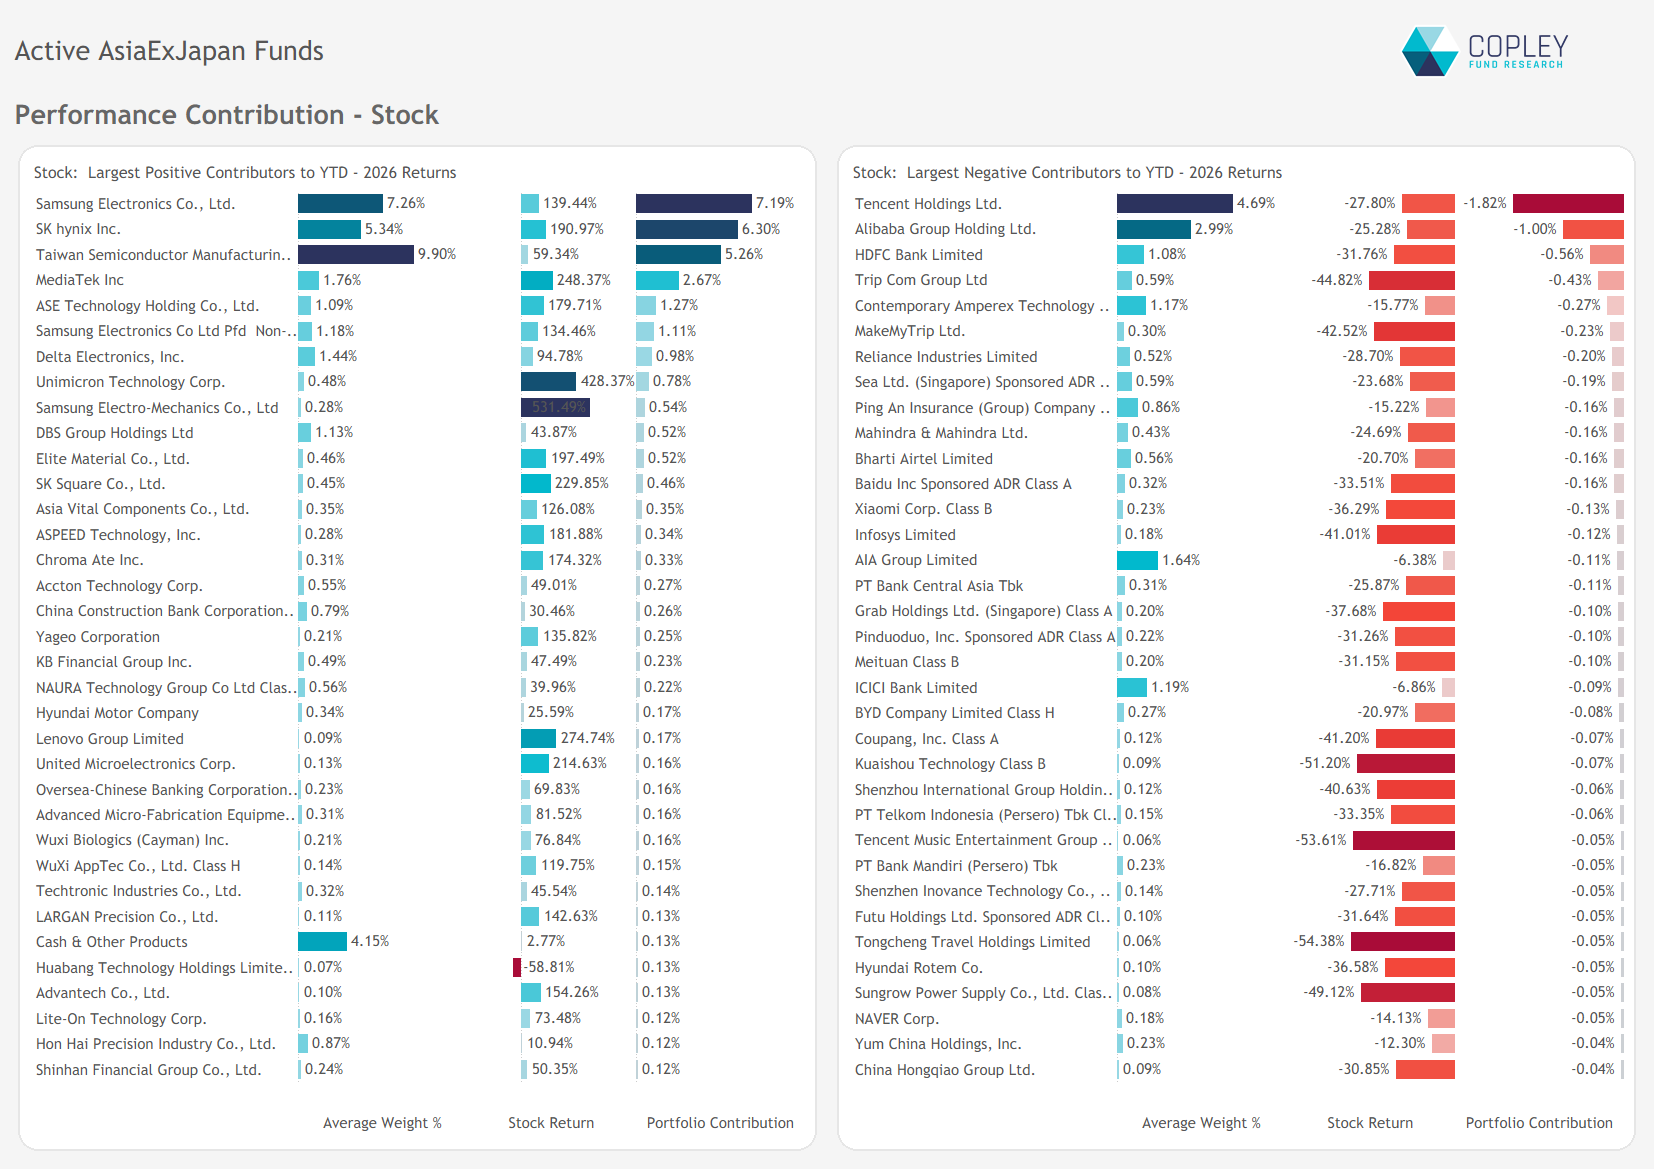
Samsung Electronics (+7.19%), SK hynix (+6.30%) and TSMC (+5.26%) added 18.75% between them, roughly three-quarters of the average fund’s return. MediaTek added a further 2.67% after rising 248%. Further down the list, Samsung Electro-Mechanics (+531%) and Unimicron (+428%) recorded exceptional gains from small average weights.
The largest detractors were widely held names that have long featured in Asian portfolios: Tencent (-1.82%), Alibaba (-1.00%), HDFC Bank (-0.56%), Trip.com (-0.43%) and CATL (-0.27%). MakeMyTrip, Reliance Industries, Sea and Ping An also featured among the detractors.
Korea and India added value; the Taiwan underweight and cash cost the most
The -0.75% shortfall was the net result of sizeable gains and losses that largely offset one another.
Positive contributors:
- South Korea. Stock selection added 1.46% and allocation 0.67% in a market that rose 106.59%, a net +2.13%.
- India. The 3.11% underweight in a market that fell 15.05% added 1.39%, mainly through allocation.
- Taiwan. The 5.40% underweight in a market that rose 86.58% cost 2.15% in allocation, but stock selection added 2.31%, for a net +0.17%.
Negative contributors:
- Cash. An average weight of 4.15% cost 0.95%, more on its own than the reported 0.75% shortfall.
- China & HK. The 1.04% overweight cost 0.53%, mainly through stock selection.
- Singapore. Stock selection cost 0.45%, for a net -0.44%.
- Vietnam. The 0.64% overweight in a market that fell 14.04% cost 0.30%.
IT: stock selection more than offset the underweight
The 2.48% underweight in IT, a sector that returned 99%, cost 0.67% in allocation. Stock selection added 4.72%, for a net +4.04%. Korean IT accounted for +2.09%, Chinese IT +0.82% and Taiwanese IT +0.70%. Underweights in Materials (+0.44%), Energy (+0.39%) and Consumer Staples (+0.35%) also added value.
Financials (-1.16%, mainly stock selection) was the largest detractor. Industrials (-0.91%), Communication Services (-0.78%) and Consumer Discretionary (-0.69%) followed. These were the three largest sector overweights (+1.57%, +1.11% and +1.00%), and the latter two returned -22.53% and -19.71% respectively. At the country/sector level, the 2.24% overweight in China Industrials was the largest single cost (-1.03%).
Overweights in Korean chip names added value; the TSMC underweight cost the most
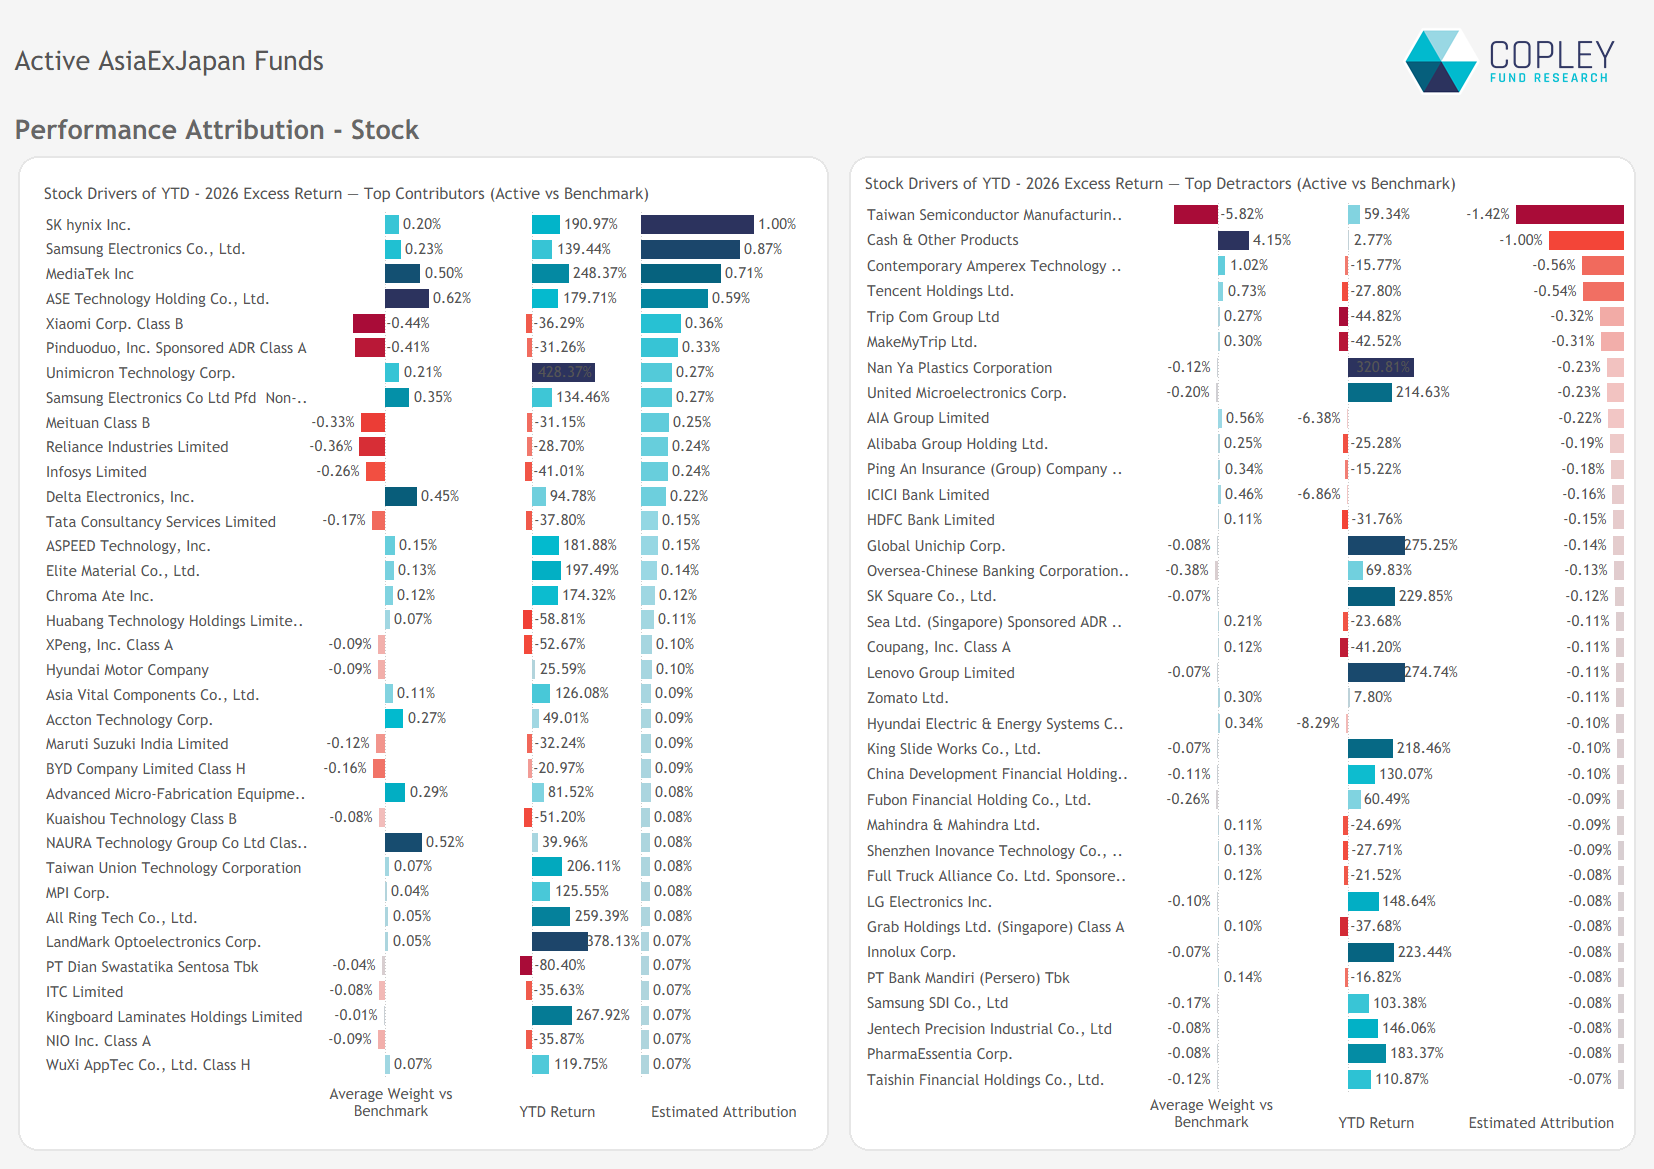
Positive stock attribution came from two sources. Overweights in SK hynix (+1.00%), Samsung Electronics (+0.87%), MediaTek (+0.71%) and ASE Technology (+0.59%) added value, as did underweights in Xiaomi (+0.36%), PDD (+0.33%), Meituan (+0.25%), Reliance Industries and Infosys (+0.24% each).
The largest detractor was TSMC (-1.42%), where the average fund was 5.82% underweight a stock that rose 59%. Overweights in CATL (-0.56%), Tencent (-0.54%), Trip.com (-0.32%) and MakeMyTrip (-0.31%) also detracted, as did small underweights in Nan Ya Plastics and United Microelectronics (-0.23% each), which rose 321% and 215% respectively.
Lower active share funds performed best
With returns concentrated in a small number of semiconductor stocks, funds positioned closer to the index performed best. Low-active and Growth funds both finished ahead of the index return of 25.07%.
- Active share: low-active funds returned 28.43%, against 11.08% for high-active funds.
- Style: Growth funds returned 26.05% and GARP funds 23.13%. Value funds returned 14.31%.
- Market cap: Large/Megacap funds returned 24.87%. Small/Midcap funds returned 10.54%.
Dispersion remained wide. Allianz Global Investors Fund – Emerging Asia Equity returned 57.69% and PineBridge Asian Fund 45.25%, while VT Halo Global Asian Consumer returned -16.58%. Five of the 159 funds lost money.
Asia ex-Japan Performance & Attribution Pack: Q3 2026
The full pack behind this piece covers performance, country, sector and stock attribution for the average active Asia ex-Japan fund. It also includes 1, 3, 5 and 10-year peer rankings.
Related Posts
- Steve Holden
- August 29, 2023
Asia Ex-Japan Fund Positioning Analysis, August 2023
104 Asia Ex-Japan Funds, AUM $66bn Asia Ex-Japan Fund Positioning Analysis, August 2023 In this ..
- Steve Holden
- March 17, 2025
Asia Ex-Japan: Positioning Chart Pack, March 2025
Asia Ex-Japan: 94 Funds, AUM $94bn Asia Ex-Japan: Positioning Chart Pack, March 2025 Inside Thi ..
- Steve Holden
- March 29, 2024
Asia Ex-Japan Funds: Stock Radar
100 Asia Ex-Japan active equity funds, AUM $53bn Asia Ex-Japan Funds: Stock Radar Summary In th ..