Active GEM Funds: Performance & Attribution H1 2026
- Steve Holden
- 0 Comments
Global Emerging Markets
Active GEM Funds: Performance & Attribution H1 2026
July 20th 2026
- Active Emerging Market funds almost matched the benchmark in H1 2026, with 51.7% of managers outperforming despite an exceptionally concentrated market rally.
- Technology dominated returns, but unlike their Global peers, active EM managers added value through strong stock selection within the sector.
- Performance was driven by a remarkably small number of AI-related stocks in South Korea and Taiwan, highlighting just how concentrated Emerging Markets leadership became during the first half.
An Excellent 1st Half
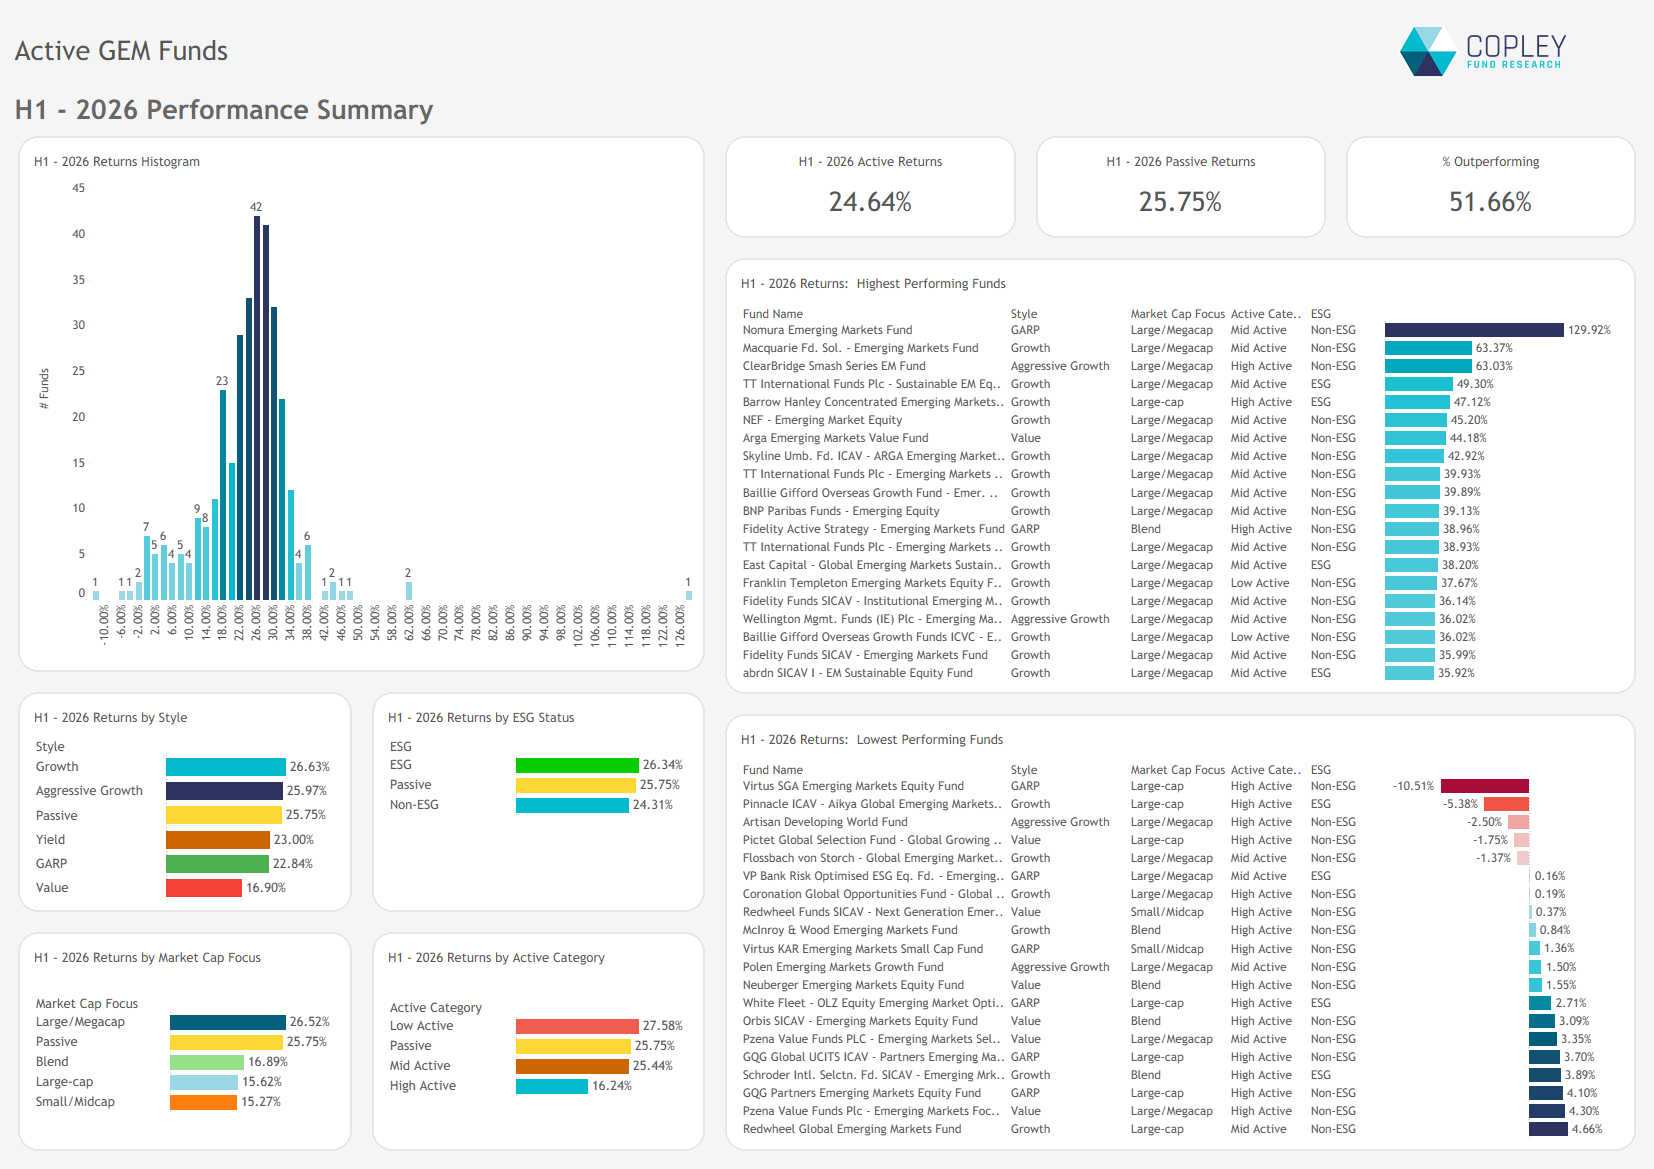
Active GEM funds rebounded strongly in the second quarter of 2026 following a volatile first quarter, which finished broadly flat. Average returns of 24.64% for the year-to-date almost matched the iShares MSCI Emerging Markets ETF benchmark return of 25.7%, with 51.7% of funds outperforming the index.
Growth strategies now lead the field, with both Growth and Aggressive Growth styles outperforming the benchmark on average. Value, by contrast, significantly lagged, returning just 16.9% over the first half.
The strongest performers were well ahead of both the benchmark and their peers. Excluding the highly concentrated Nomura Emerging Markets Fund, whose 35% position in SK Square materially influenced returns, several managers generated gains in excess of 40% during the first half, including strategies from TT International, Barrow Hanley and ARGA.
A Concentrated Rally
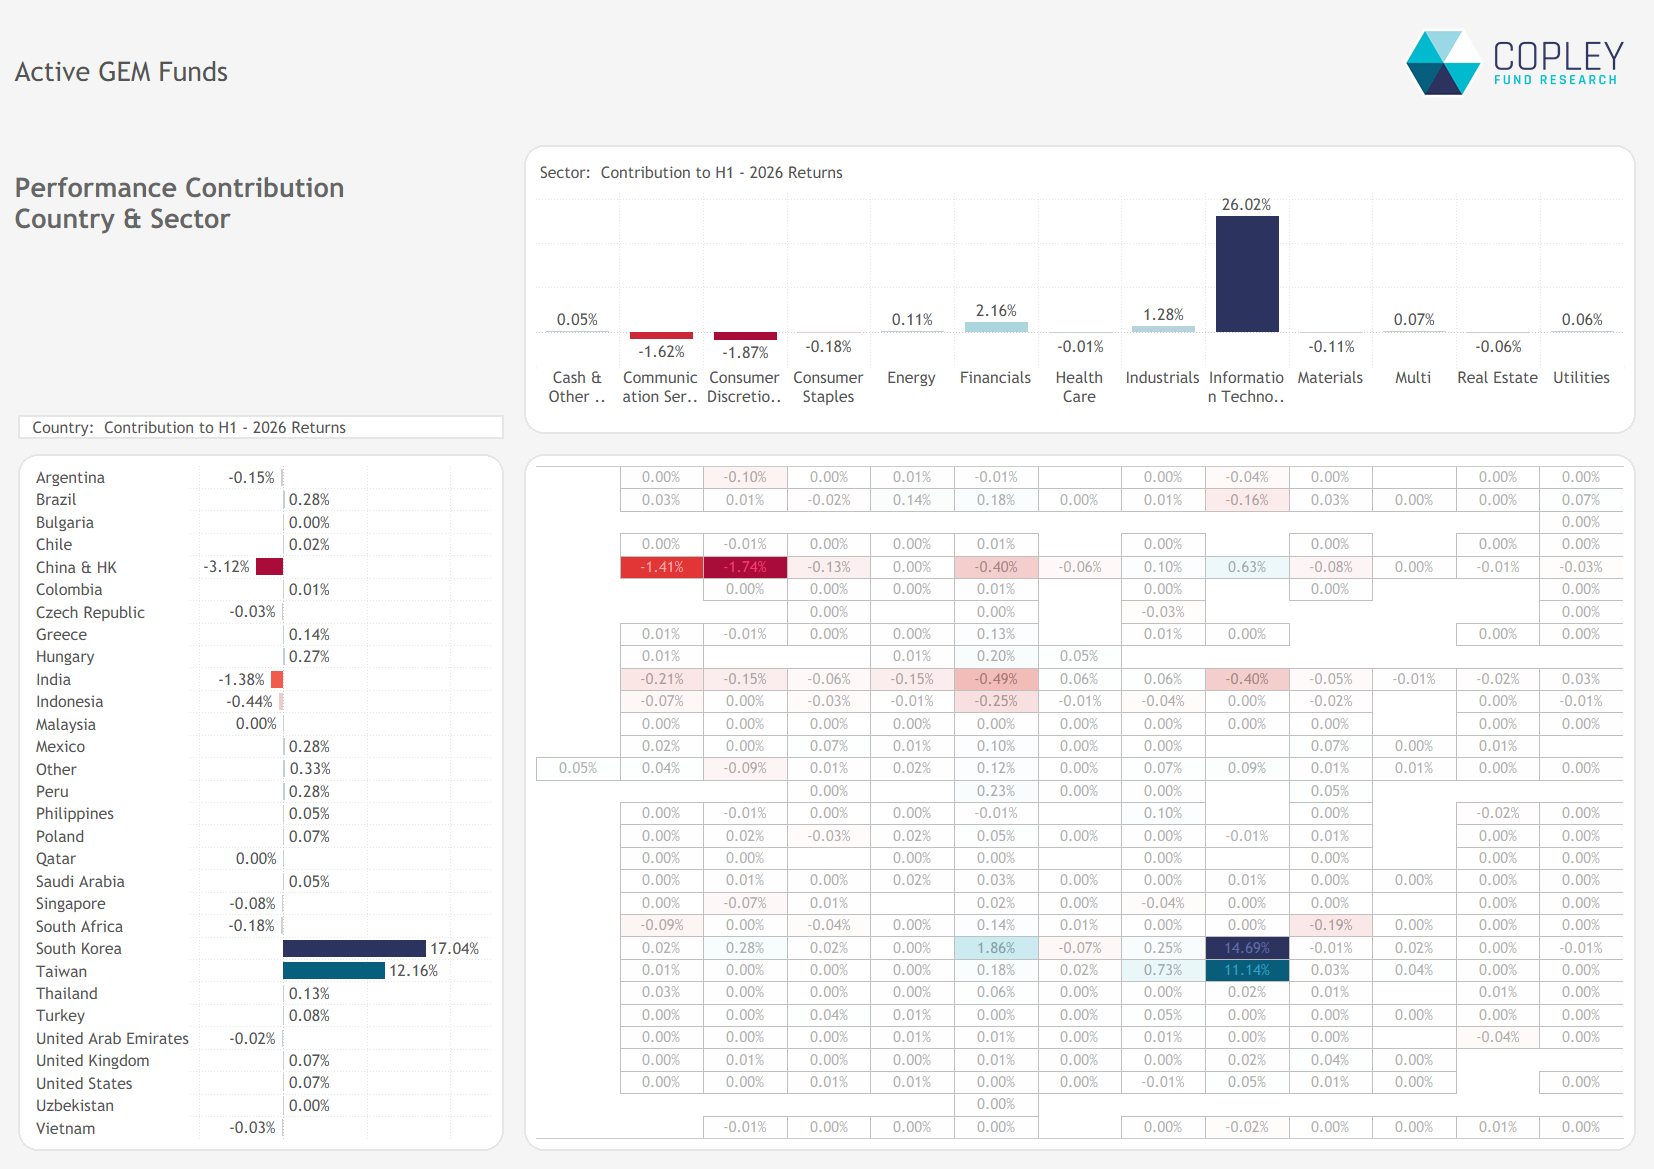
The charts below break down first-half return contributions by country and sector, based on a portfolio constructed from managers’ aggregate holdings. The portfolio returned 25.9% over the period, with Technology accounting for 26% of total returns.
The concentration becomes even more striking at the country level. South Korean Technology and Taiwanese Technology alone contributed 25.8% of first-half returns, highlighting just how dependent Emerging Markets performance was on a narrow group of AI-related beneficiaries. This was far from a broad-based rally.
Outside Technology, Financials and Industrials made positive, albeit modest, contributions. These gains were largely offset by weakness in Communication Services and Consumer Discretionary, while China & Hong Kong and India together detracted 4.5% from first-half returns.
Stock Level Concentration
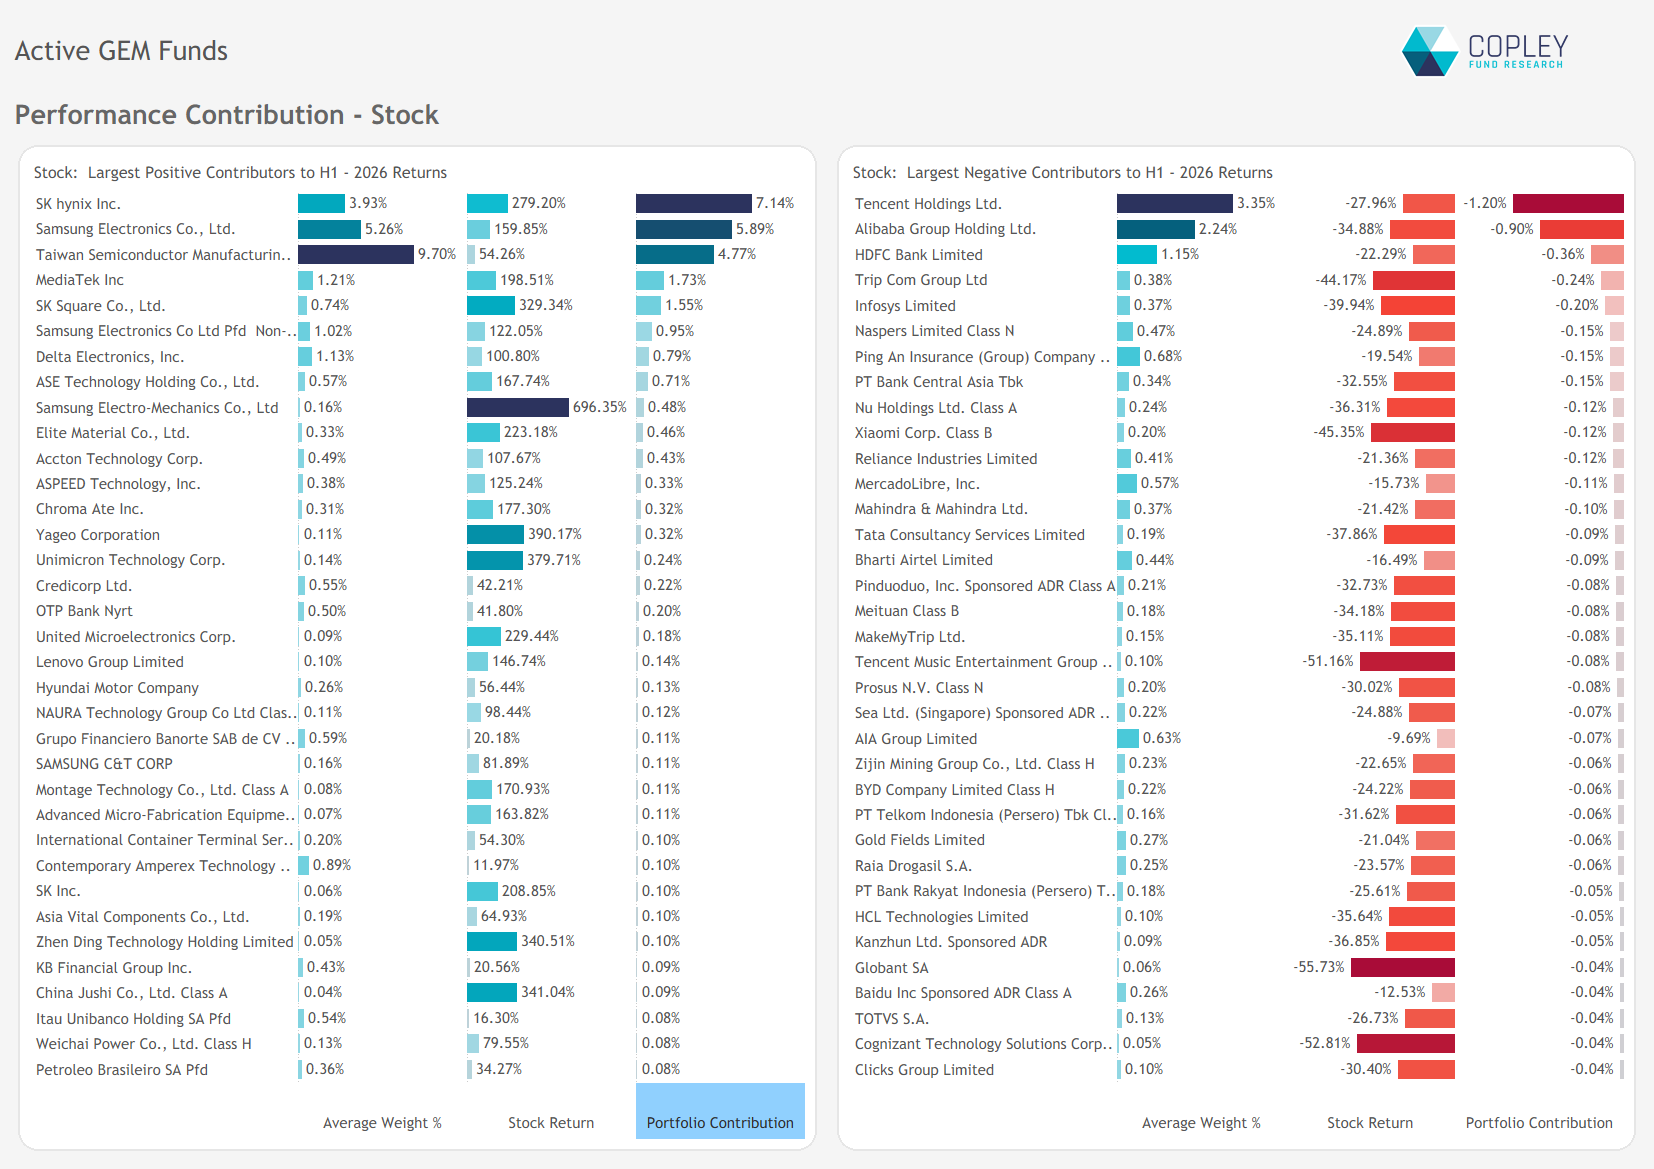
The concentration observed at the country level becomes even more pronounced when viewed through the underlying stocks. Just five companies accounted for 22% of total first-half returns, led by SK Hynix, Samsung Electronics and TSMC. More remarkably, the fifteen largest contributors to returns were all listed in either South Korea or Taiwan.
At the other end of the spectrum, the principal detractors came from China and India. Tencent, Alibaba and HDFC Bank accounted for the majority of the weakness, with further negative contributions from Trip.com Group and Infosys.
The country-level dispersion seen across Emerging Markets was therefore largely a function of stock-level concentration, rather than broad-based strength or weakness within individual markets.
Performance Attribution – Where Funds Beat the Benchmark
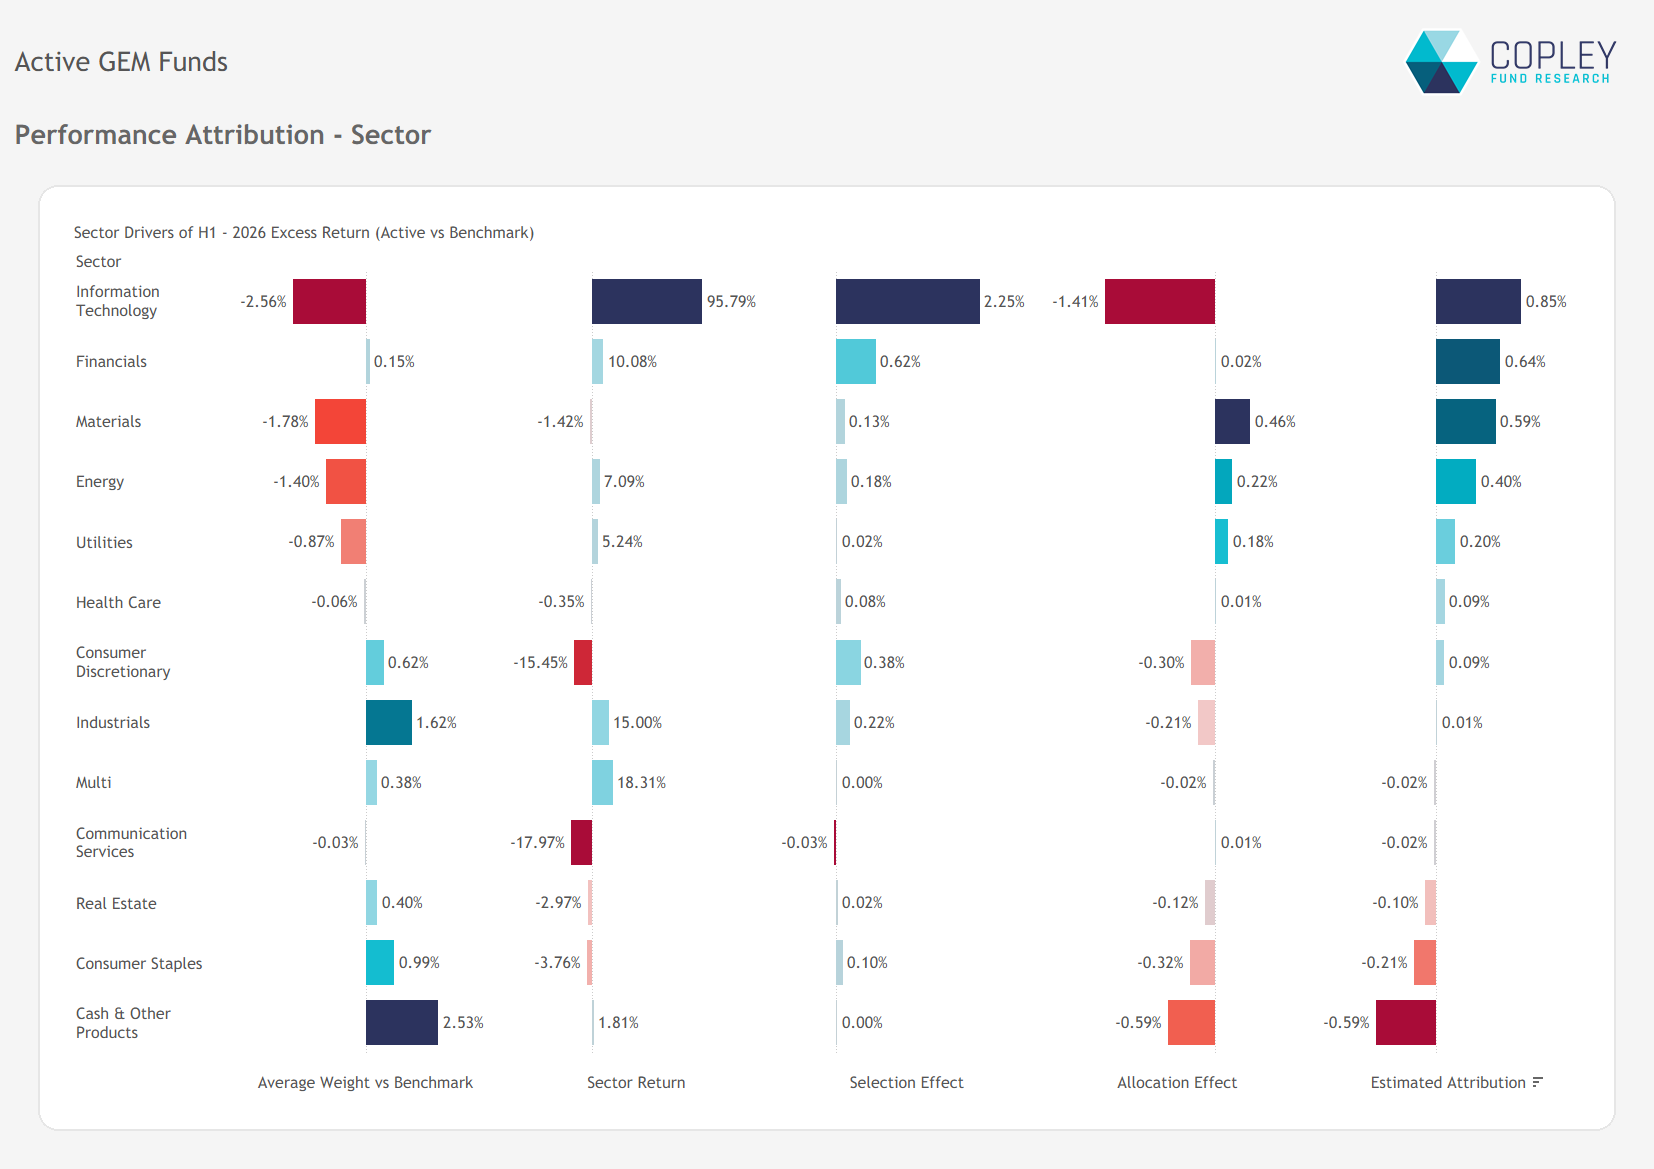
The chart below breaks down the principal sources of relative performance by sector, highlighting where active managers added value against the benchmark.
Unlike their Global peers, Emerging Market managers navigated the Technology sector well. Despite maintaining a meaningful underweight position, strong stock selection within Technology more than offset the allocation drag, making it the single largest contributor to relative outperformance.
The main detractors were cash holdings and overweight positions in Consumer Staples and Real Estate. These were partially offset by underweights in Materials, Energy and Utilities, all of which contributed positively to relative returns.
Stock Attribution
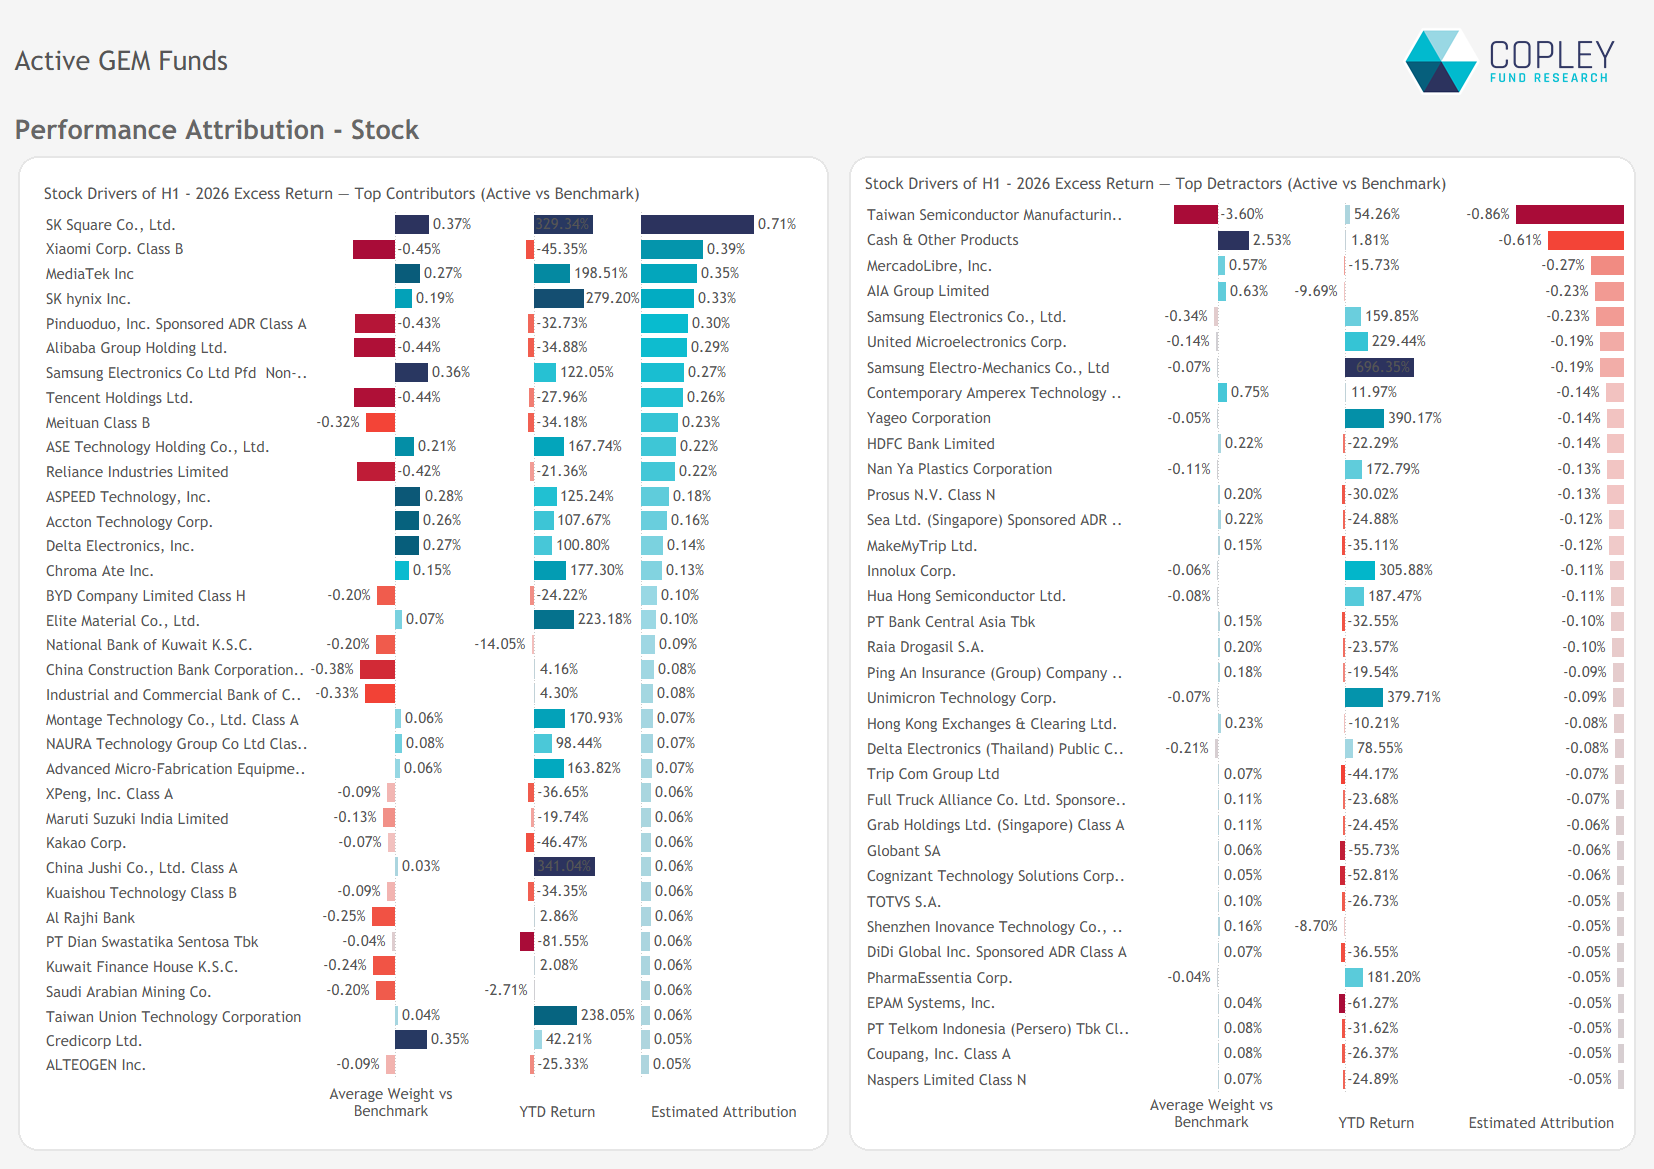
At the stock level, Emerging Market managers made a number of the key Technology calls that eluded their Global peers. Overweights in SK Square, MediaTek and SK Hynix, together with underweights in Xiaomi, PDD Holdings and Alibaba Group, were the principal contributors to active outperformance.
These gains were partly offset by underweights in TSMC, a position often constrained by UCITS diversification limits, together with cash holdings and disappointing returns from large overweight positions in MercadoLibre and AIA Group.
Long-Term Performance
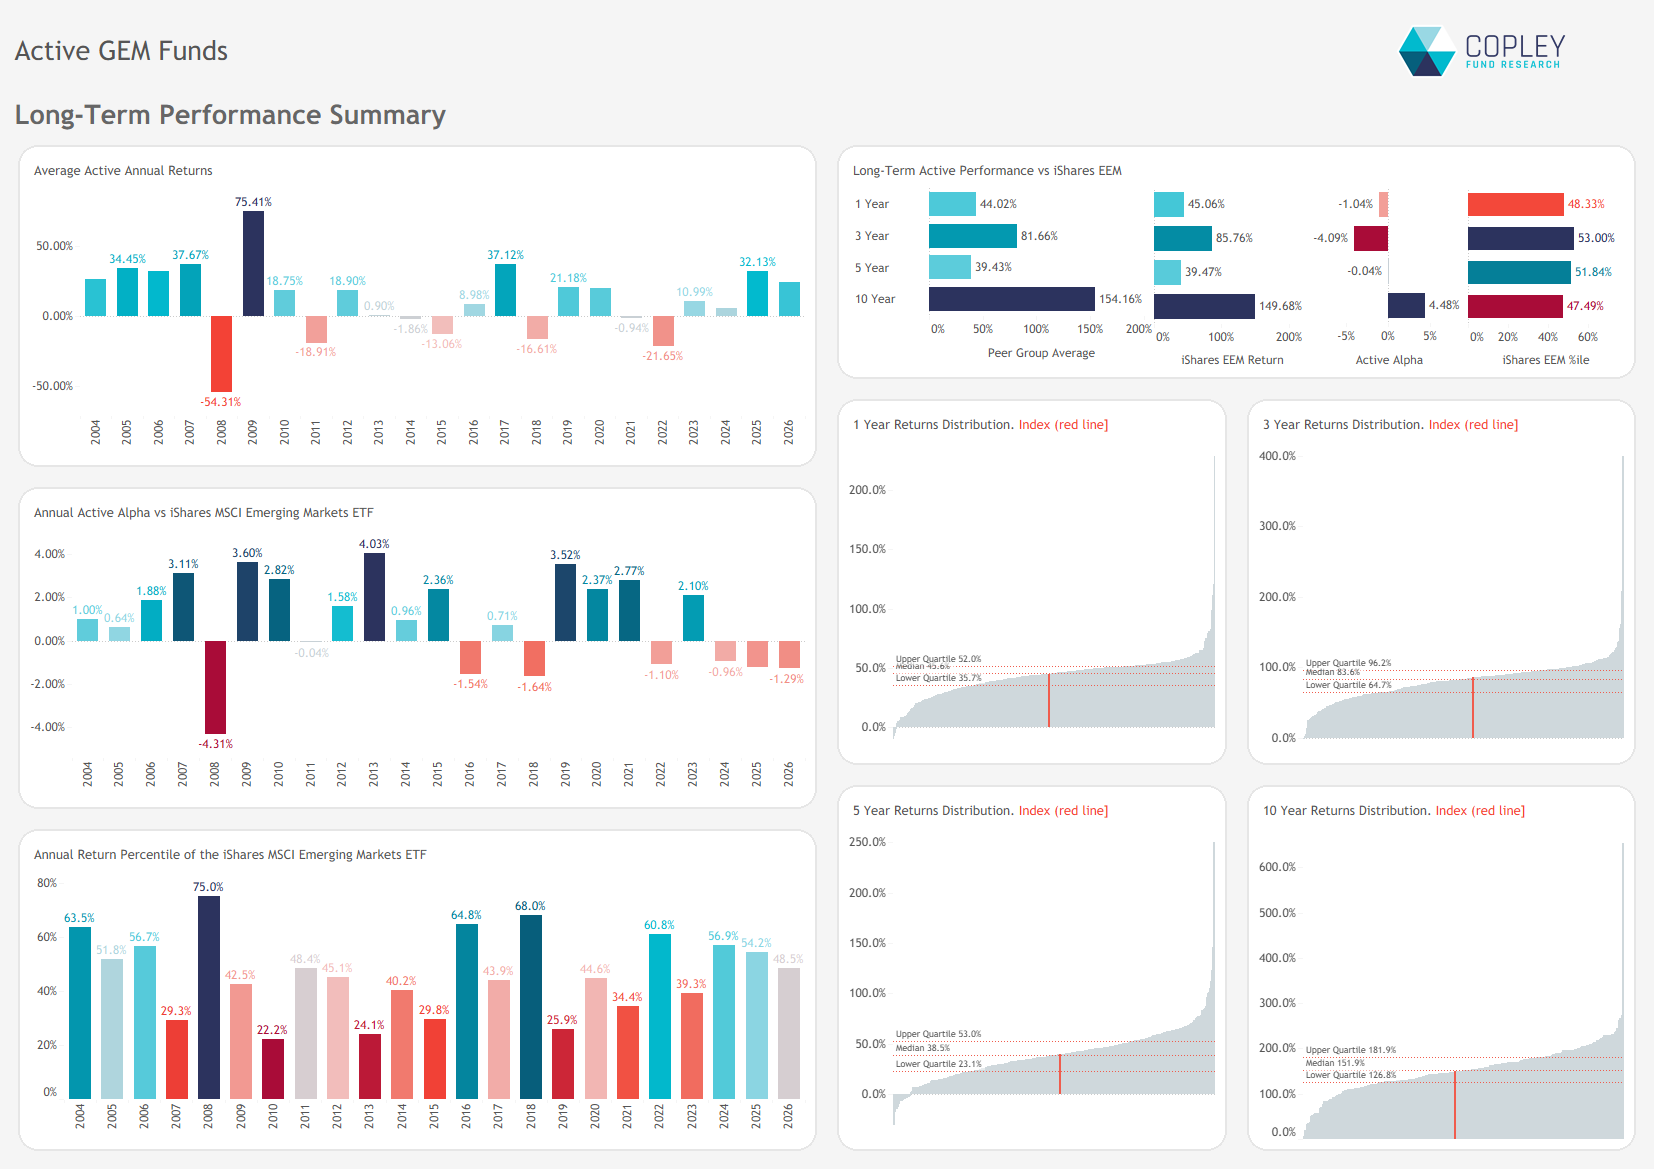
Despite the narrow nature of this year’s rally, Emerging Market active managers continued to compare favourably with the benchmark. While the iShares MSCI Emerging Markets ETF has modestly outperformed the average active fund over the past two and a half years, it has generally remained around the 50th percentile of the active universe.
That contrasts sharply with Developed Markets, where passive benchmarks have become increasingly difficult to beat. Emerging Markets therefore remains one of the few major asset classes where active management continues to demonstrate its ability to compete over the long term, despite an increasingly concentrated market backdrop.
Related Posts
- Steve Holden
- August 28, 2023
GEM Fund Positioning Analysis, August 2023
372 emerging market Funds, AUM $423bn GEM Fund Positioning Analysis, August 2023 In this issue: ..
- Steve Holden
- February 25, 2026
MENA’s Next Phase: Structural Adoption and the Rise of Regional Anchors
China allocations have recovered from the lows, but momentum has stalled—masking active shift ..
- Steve Holden
- October 24, 2024
Emerging Markets Ex-China Insights, October 2024
30 EM Ex-China Funds, AUM $1.7bn Active EM Ex-China Funds: Positioning Insights, October 2024 H ..