This report examines portfolio breadth and ownership patterns across the Asia Ex-Japan region, breaking down holdings by fund participation to understand where conviction is building, where it is fading, and how portfolios are evolving.
We look across the full distribution—from the most widely held stocks to the long tail of lesser-owned names—highlighting how different parts of the market behave, how stocks move between ownership cohorts, and where positioning is becoming more concentrated.
Together, these dynamics provide a clearer picture of how active managers are expressing views across Asia, and how the structure of portfolios is shifting beneath the surface.
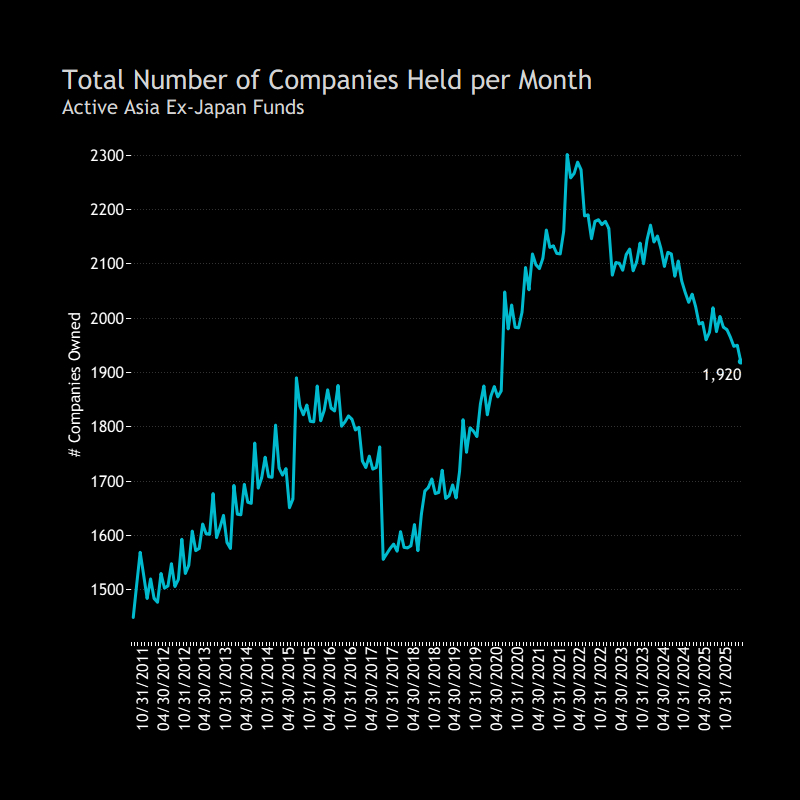
How Many Companies Do Active Asia Ex-Japan Investors Own? The number of companies held by active Asia ex-Japan funds peaked at just over 2,300 in 2021, before trending lower to ~1,920 today. Breadth is now clearly normalising after a period of expansion.
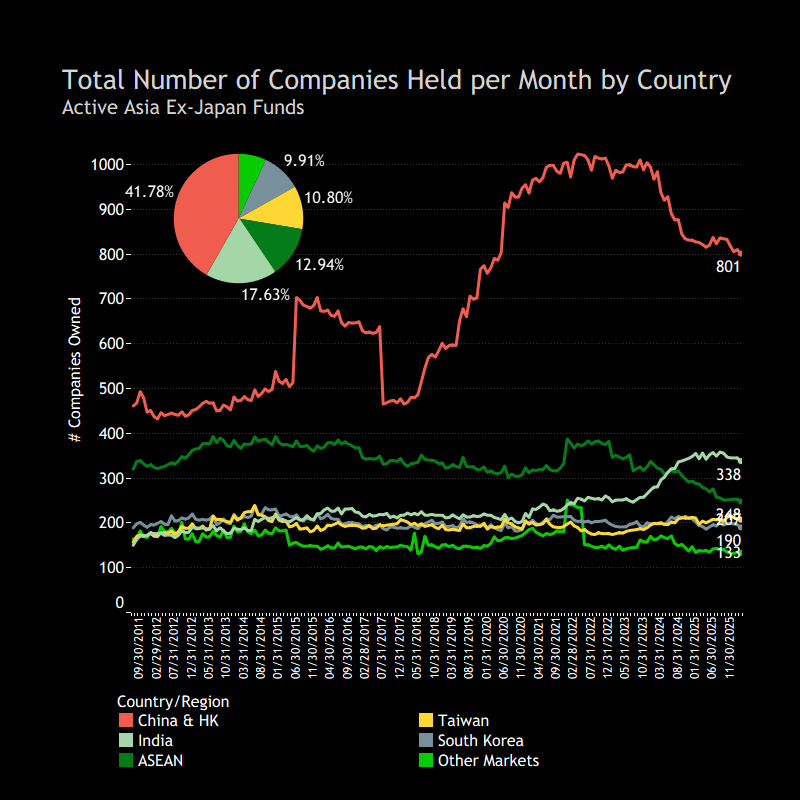
Positioning remains concentrated in North Asia. China & HK dominates with 801 companies (~42% of the total), followed by India at 338 (~18%). Elsewhere, exposure is more fragmented, with South Korea (248), Taiwan (208), and ASEAN (190) each representing smaller shares.
Overall, the story is one of moderating breadth alongside persistent concentration in the region’s largest markets.
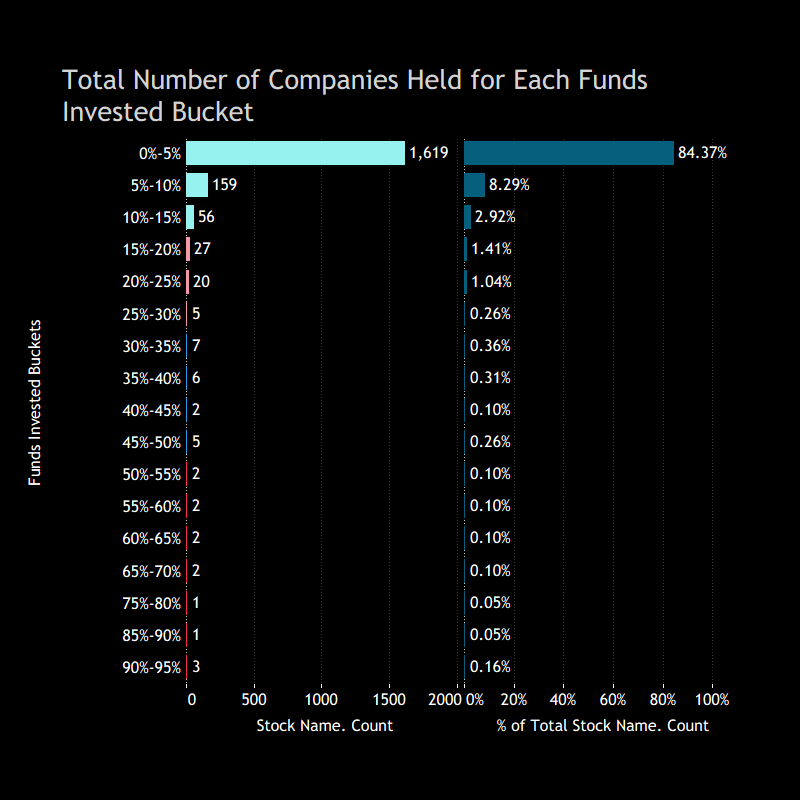
Ownership Breadth Ownership breadth across Asia ex-Japan portfolios is highly skewed. The vast majority of stocks are held by only a small fraction of funds, with 1,619 companies owned by fewer than 5% of investors (~84% of the universe). From there, the opportunity set narrows quickly, with only a small cohort of names achieving broad ownership.
However, this skew in stock count is less pronounced in portfolio weights. Stocks held by fewer than 15% of funds account for over 95% of names, but still represent ~30% of the average portfolio. Managers are clearly differentiating through the long tail, but position sizes remain relatively modest.
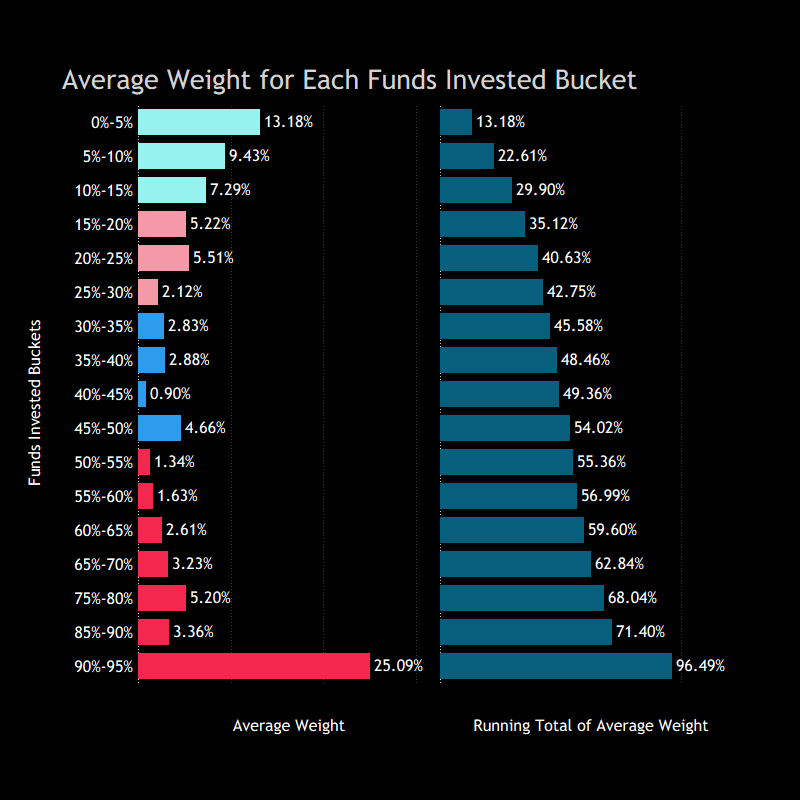
At the top end, ownership is far more concentrated. A very small group of stocks held by more than 50% of funds accounts for a disproportionately large share of capital, with the most crowded names (90–95% ownership) alone representing ~25% of average portfolio weight.
The result is a familiar structure: broad dispersion in stock selection, but with portfolios anchored by a handful of high-conviction, widely owned positions.
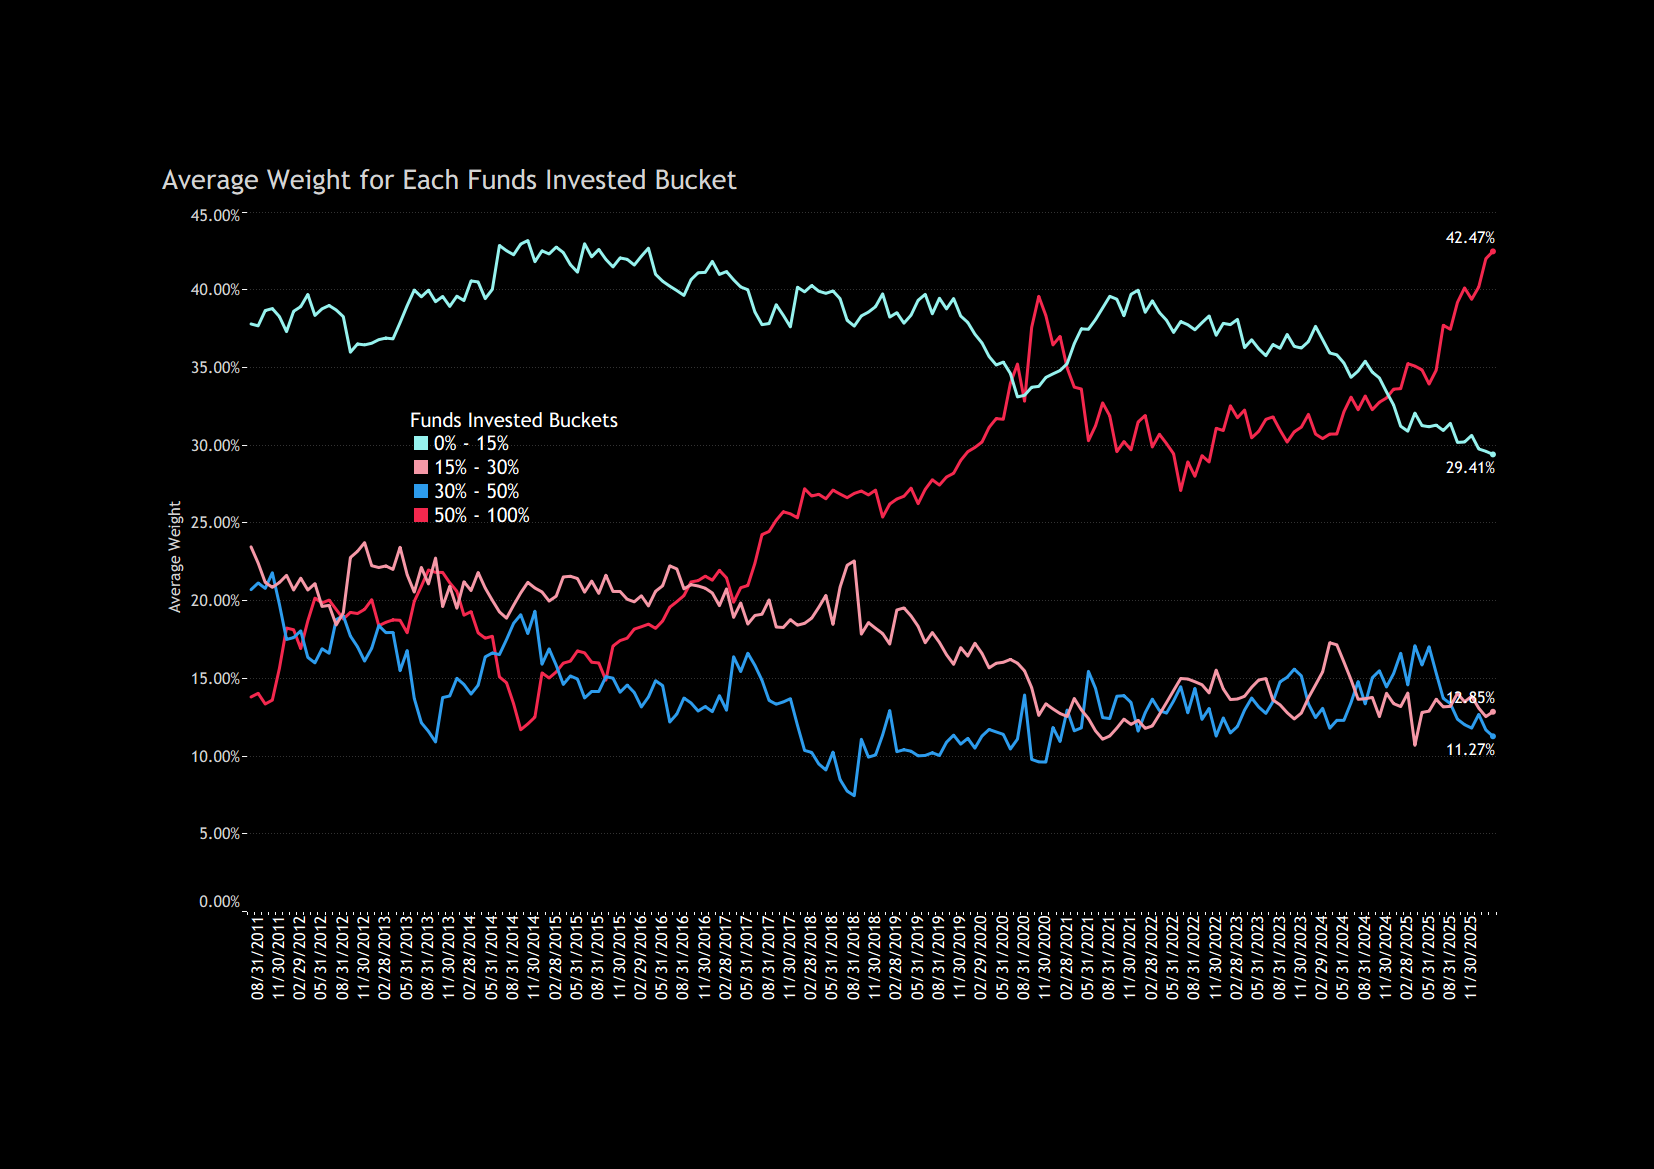
Concentration Rising: Shift Toward Consensus Asia ex-Japan portfolios have become more concentrated in high-conviction names over time. A decade ago, close to ~40% of the average fund sat in stocks owned by fewer than 15% of managers; today, that has declined to ~29%, marking a steady move away from the long tail.
This has been offset by a clear rise in the most widely held names. Stocks owned by more than 50% of funds now account for ~42% of the average portfolio, up materially over time and highlighting the growing importance of consensus positioning.
Meanwhile, the middle buckets (15–50%) have drifted lower and remain a smaller share of portfolios, reinforcing that the key shift has been a rotation out of less-owned names into the most crowded part of the market.
Stocks held by more than 50% of funds
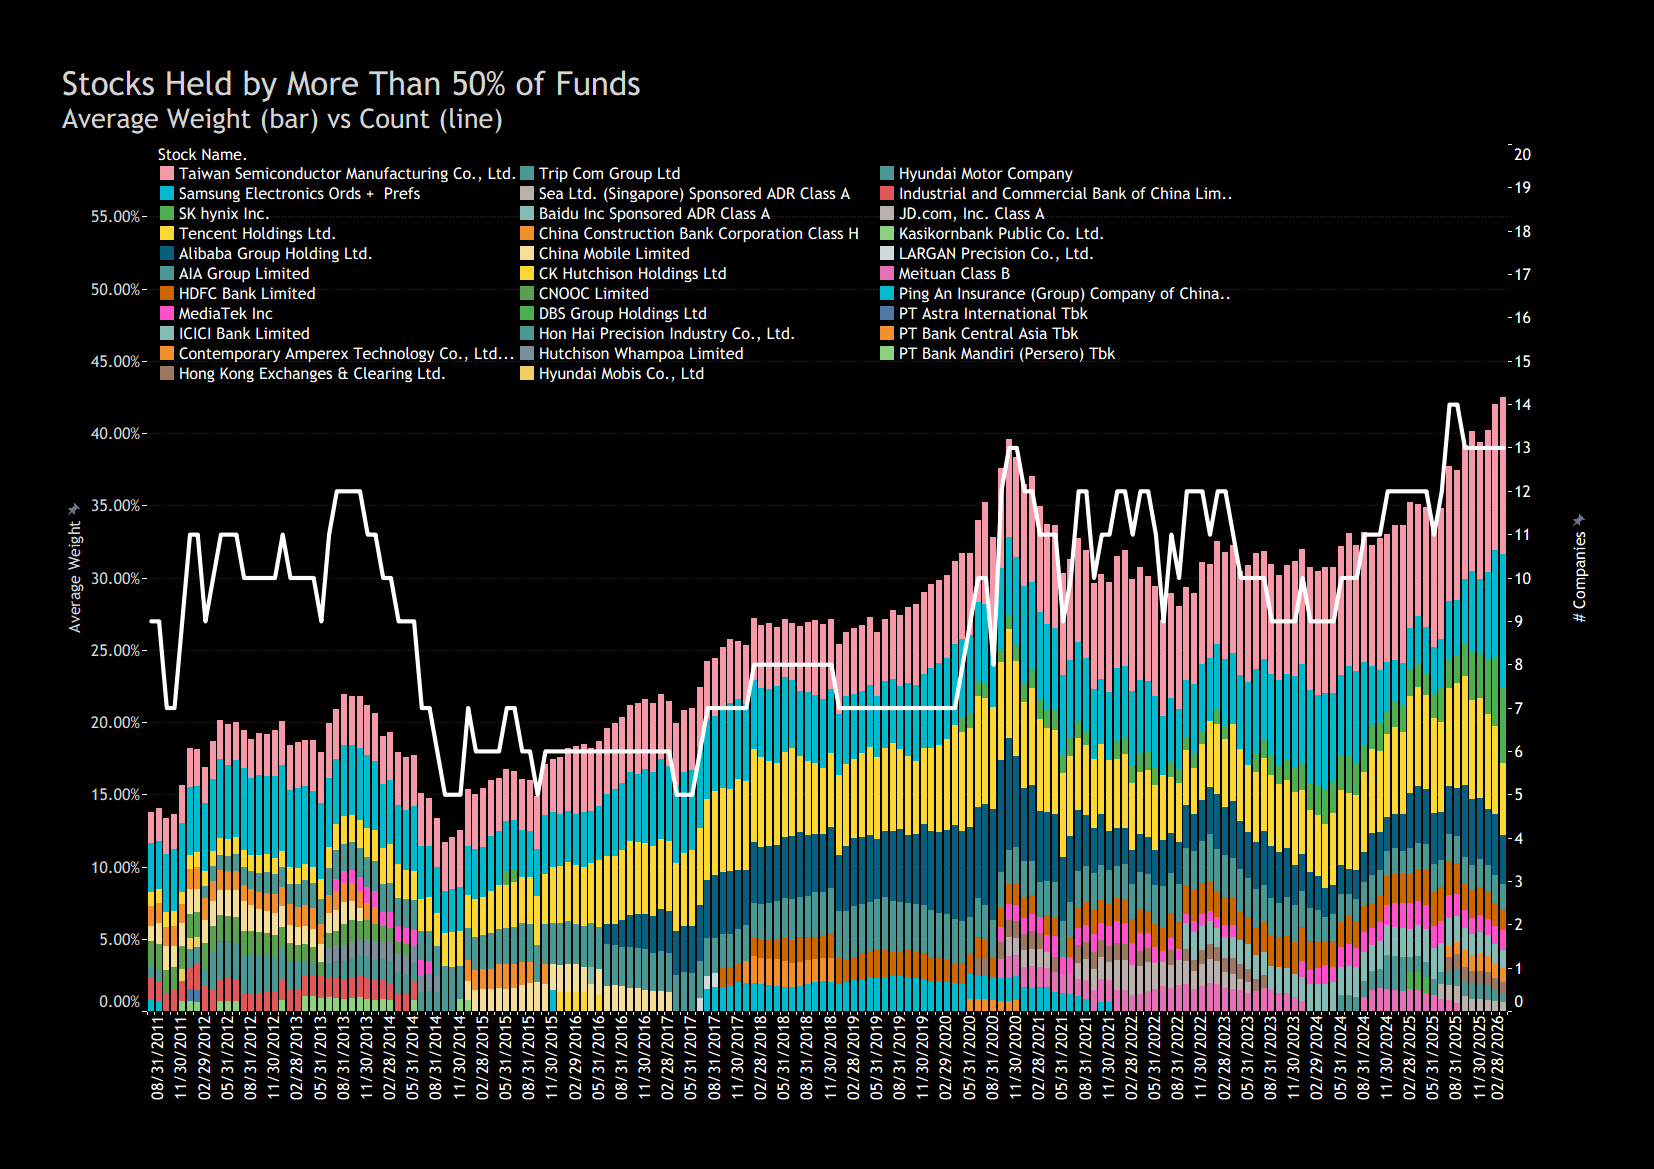
Crowding at the Top: More Names, More Weight The number of stocks held by more than 50% of Asia ex-Japan funds has trended higher, rising to 13 today. This is toward the upper end of the historical range, with a broader set of names now consistently owned across managers.
In parallel, the weight allocated to these stocks has risen steadily. From the mid-teens a decade ago, they now account for well over 40% of the average portfolio, with step-ups particularly visible from 2017 onwards and again more recently.
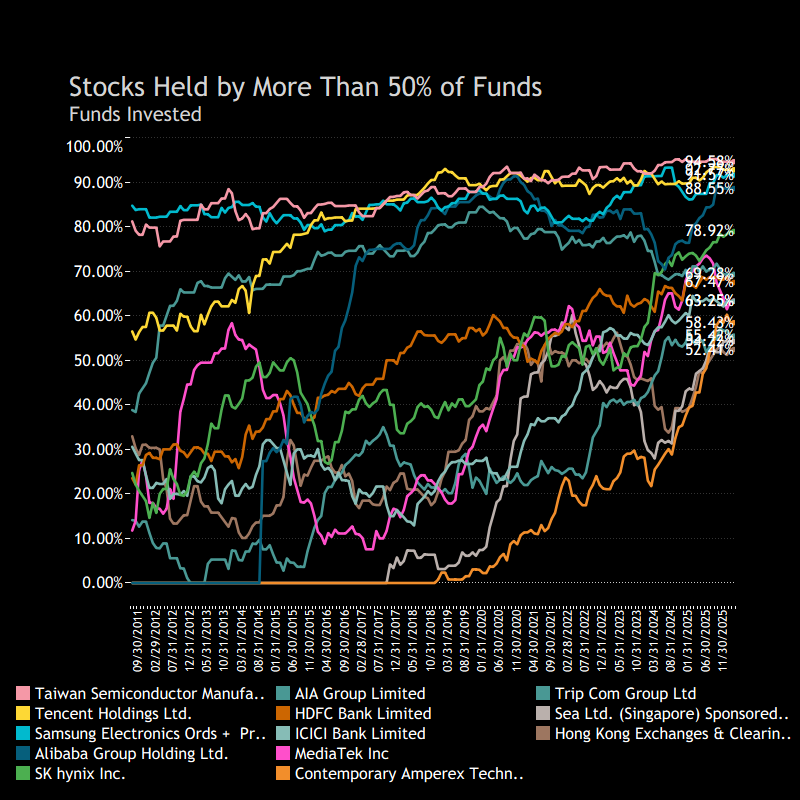
Ownership Trends within the 50% Club The current >50% cohort is relatively new. Only 5 of today’s ~13 names were already in the club prior to 2017. What stands out in the ownership chart is how many of these names begin to steepen once they move through roughly 30% fund ownership. From there, participation often builds quickly, with a number of stocks going on to reach 50%, 70% and, in some cases, well beyond that.
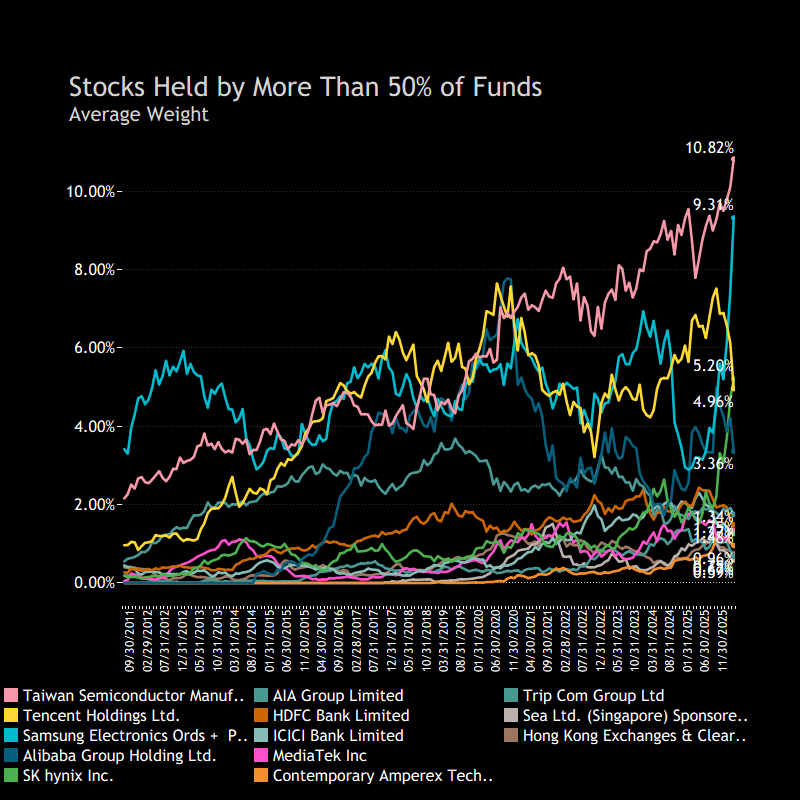
This pattern is particularly evident among newer entrants, with CATL, Hong Kong Exchanges and Sea Limited all seeing sharp increases in Asia ex-Japan fund ownership. Weights have also moved higher, though less uniformly, with TSMC, SK Hynix and Samsung driving much of the recent increase in aggregate cohort weight.
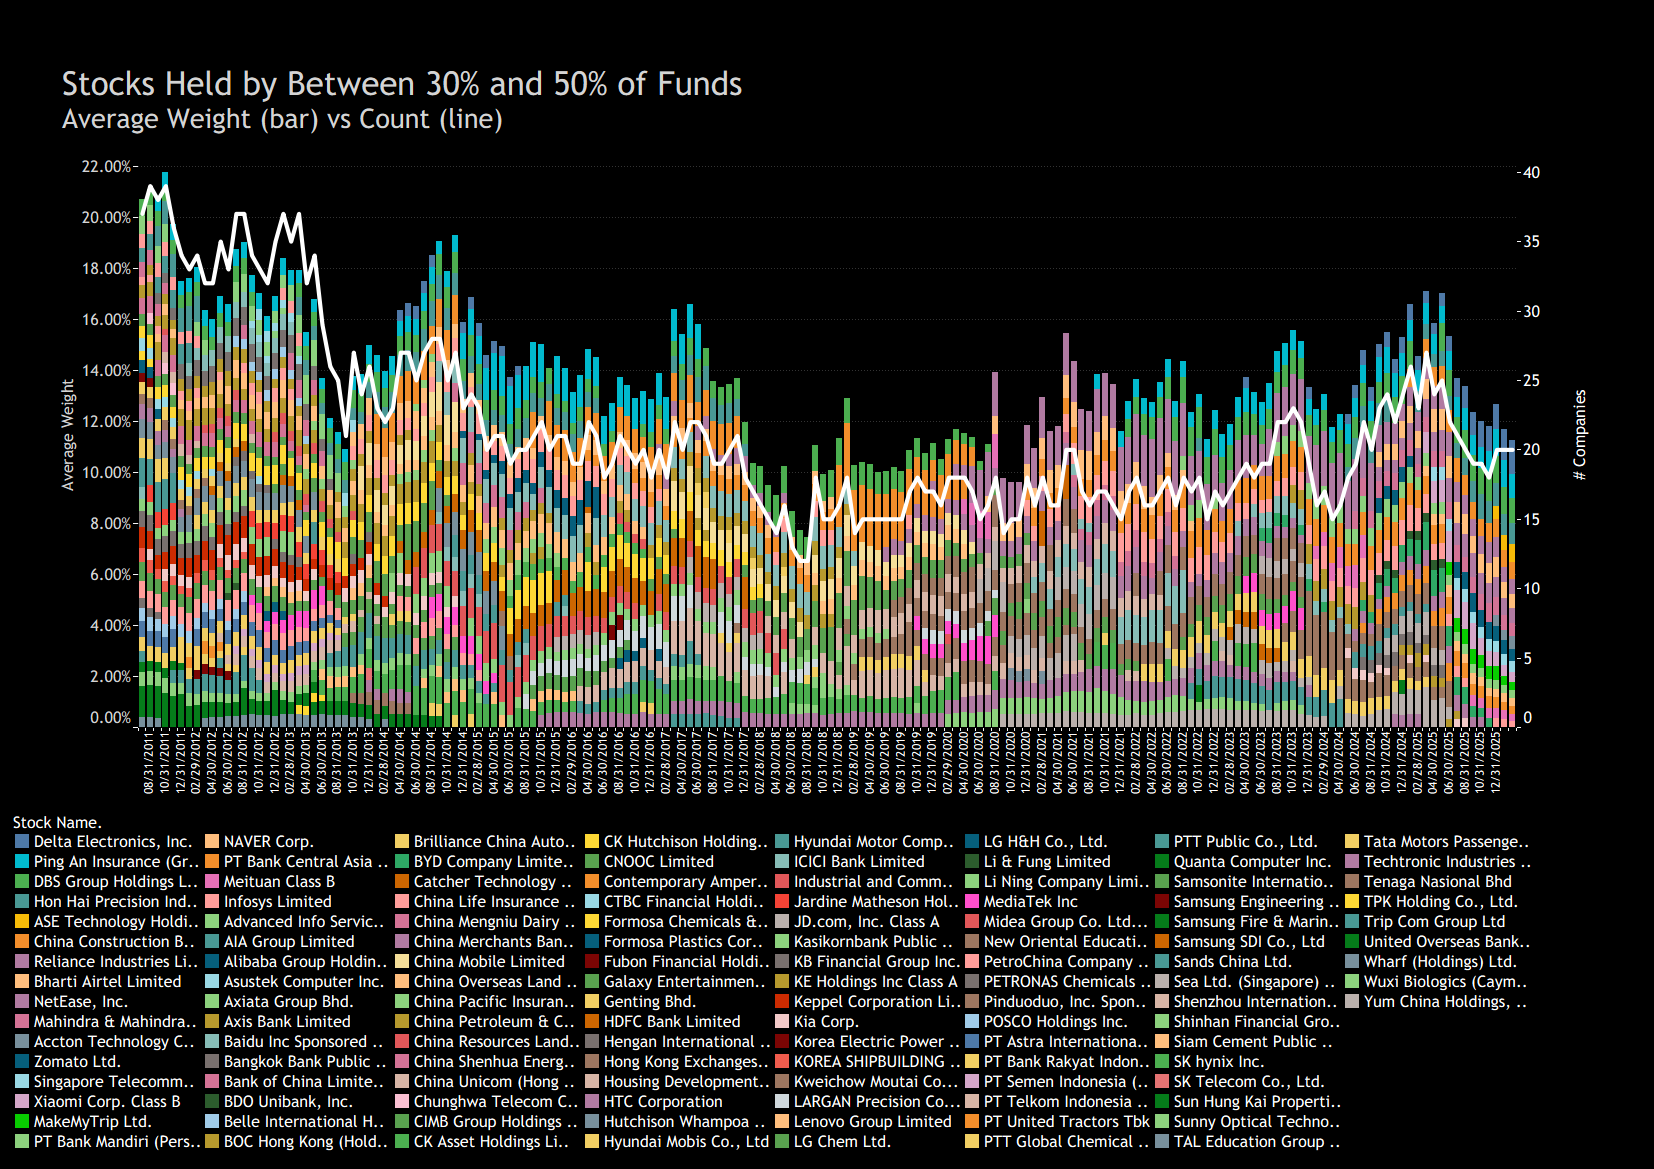
The 30% - 50% Cohort
The 30–50% ownership bucket has remained relatively contained over time. Since 2012, 121 companies have passed through this range, with the live count typically sitting in the high teens to mid-20s — a meaningful but still selective slice of the universe. In weight terms, this cohort built steadily into the mid-2010s, reaching the high-teens at its peak. More recently, that share has moved lower, now sitting closer to the low double digits.
Composition has also evolved. Earlier periods show a broader mix across sectors, while more recent years skew more toward large-cap technology and semiconductors. The bucket itself behaves less like a destination and more like a pass-through — a range where names build ownership before either moving higher into the top cohort or falling back out.
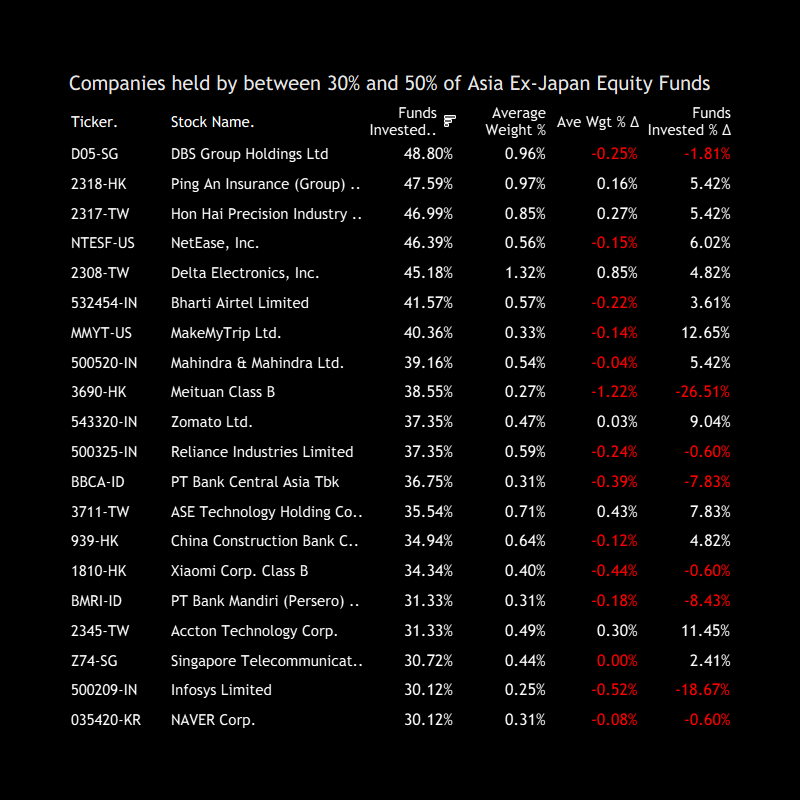
30–50% Cohort: Snapshot & Turnover Dynamics Current positioning within the 30–50% ownership range comprises 20 companies. The cohort is skewed toward large regional financials, internet platforms and domestic cyclicals, with names such as DBS, Ping An, Delta Electronics, Bharti Airtel and NetEase sitting toward the upper end of the range. Position sizes remain relatively contained, with most holdings clustered below ~1% of average fund weight, and only a handful moving modestly above that level.
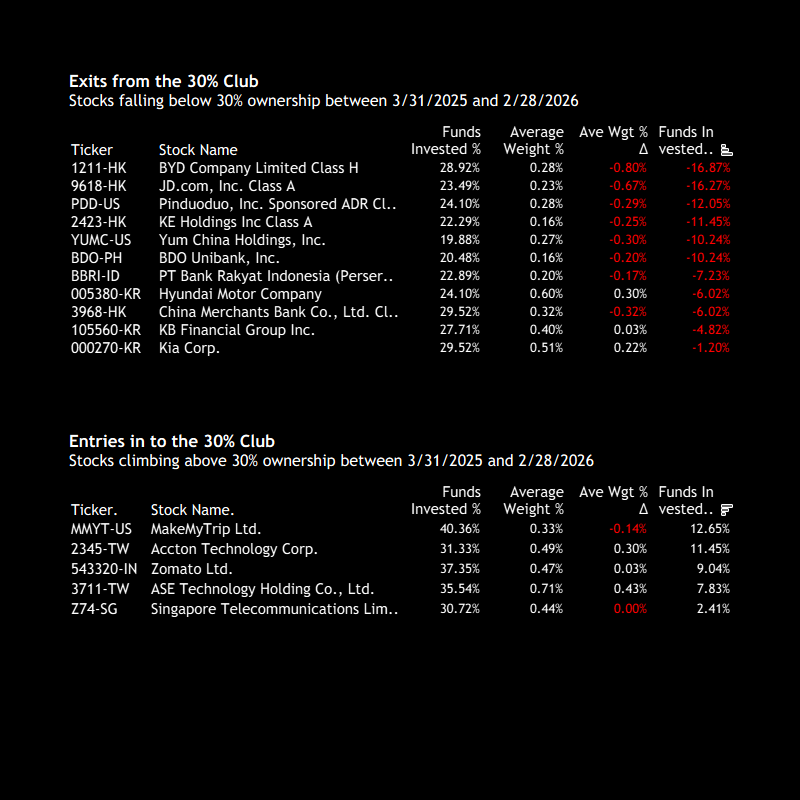
Turnover within the bucket is visible on both sides. A number of names have dropped below 30%, including BYD, JD.com and KE Holdings, alongside several Indonesian and China financials. At the same time, new entrants have moved up through the threshold, including MakeMyTrip, Accton Technology, Zomato and ASE Technology, reflecting rising fund participation.
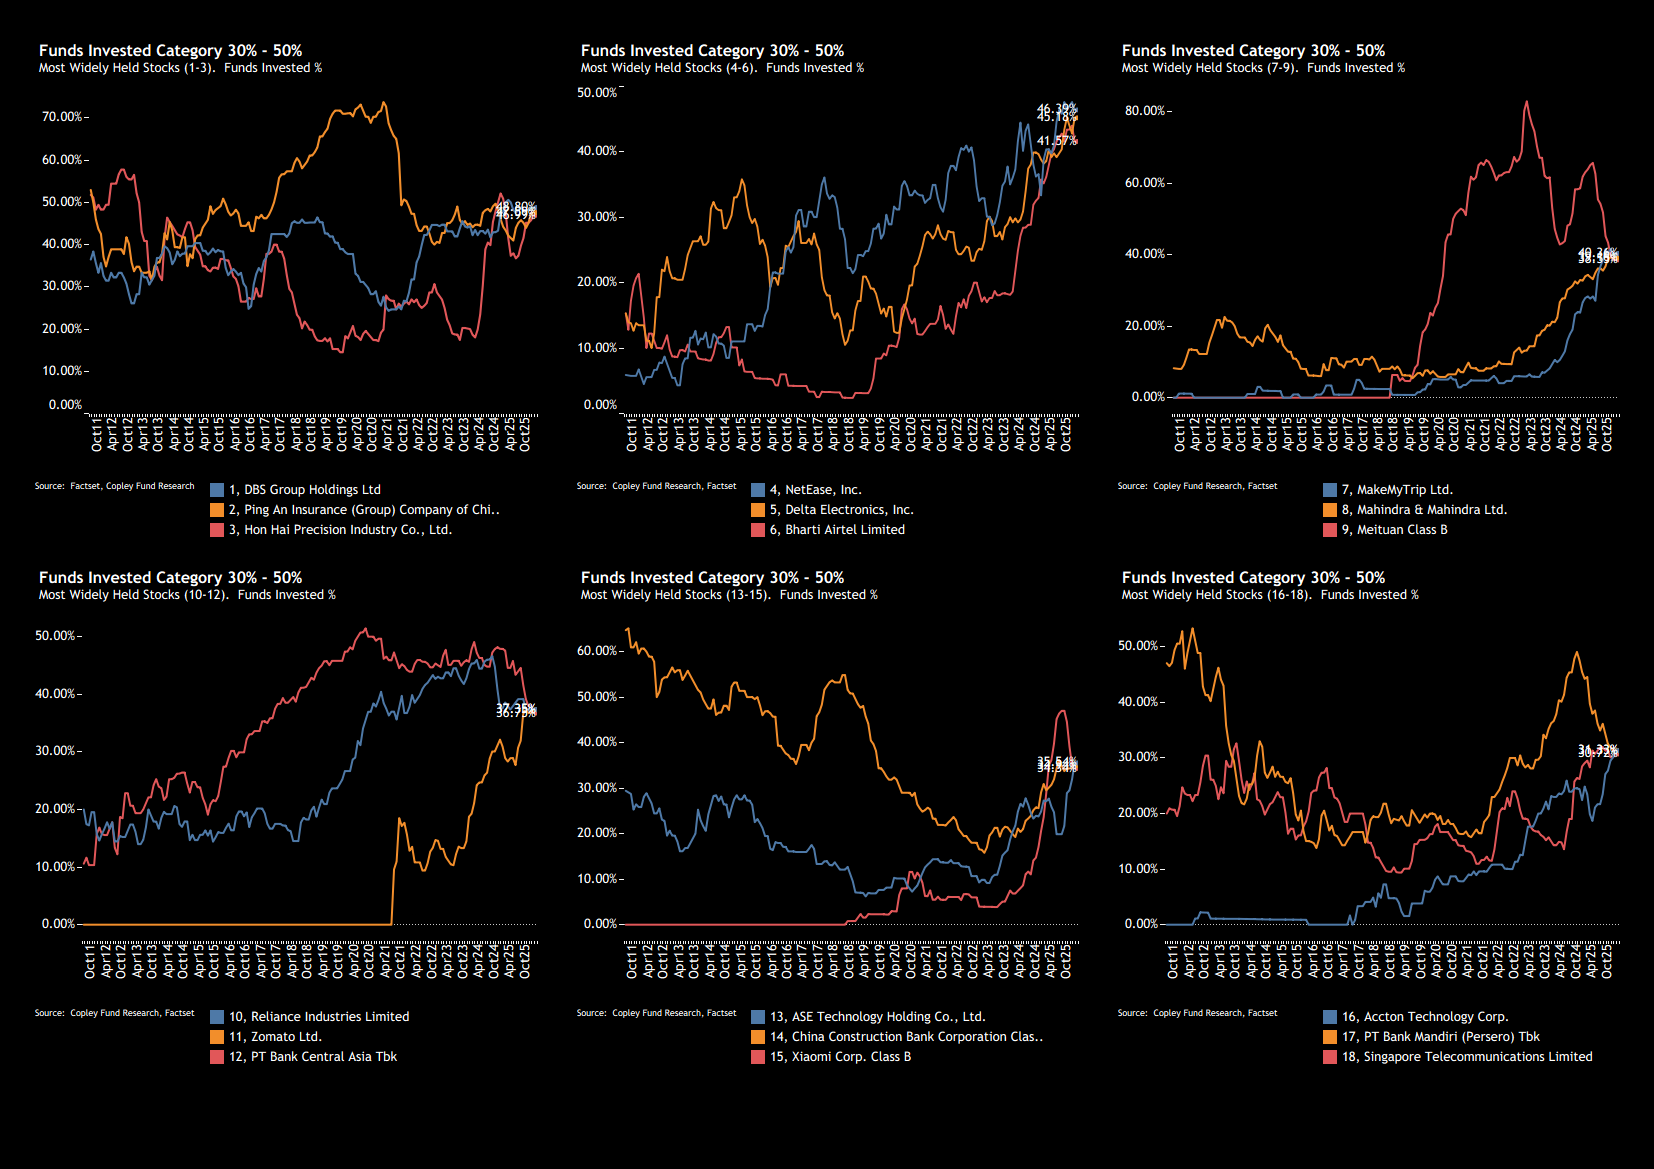
Diverging Paths Within the Middle Cohort Ownership trends across the current constituents show a wide dispersion in trajectories. Some of the more established names — such as DBS, Ping An and Hon Hai — have moved within relatively defined ranges over time, with participation rising and falling but not breaking out decisively.
In contrast, several names have seen more persistent upward trends. NetEase, Delta Electronics and Bharti Airtel have all climbed higher, pushing toward the upper end of the 30–50% range.
Elsewhere, a number of stocks remain below prior peaks. Meituan, Bank Mandiri and Bank Central Asia have all seen ownership fade in recent months.
The 15% - 30% Cohort
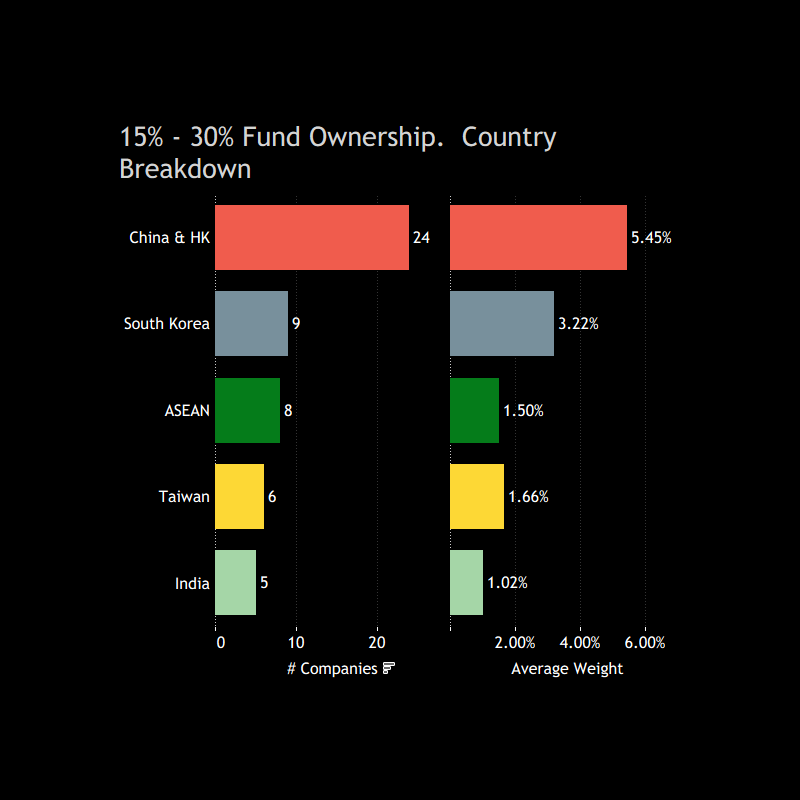
The 15–30% ownership bucket remains relatively small in Asia ex-Japan, with 52 companies in total. Regionally, it is skewed toward China & Hong Kong (24 names), which also account for the largest share of weight (~5.5%). South Korea (9), ASEAN (8) and Taiwan (6) follow, with India (5) making up a smaller portion.
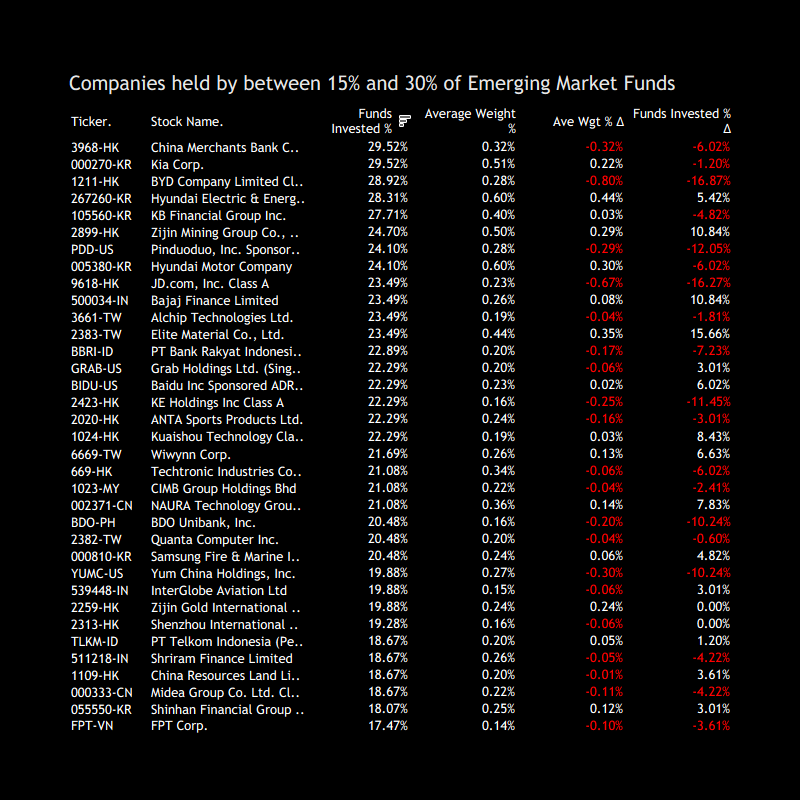
At the stock level, the cohort includes a mix of financials and cyclicals, with names such as China Merchants Bank, BYD, Hyundai Electric, KB Financial and Zijin Mining featuring in the range. Position sizes are modest, with most holdings well below 1% of average fund weight.
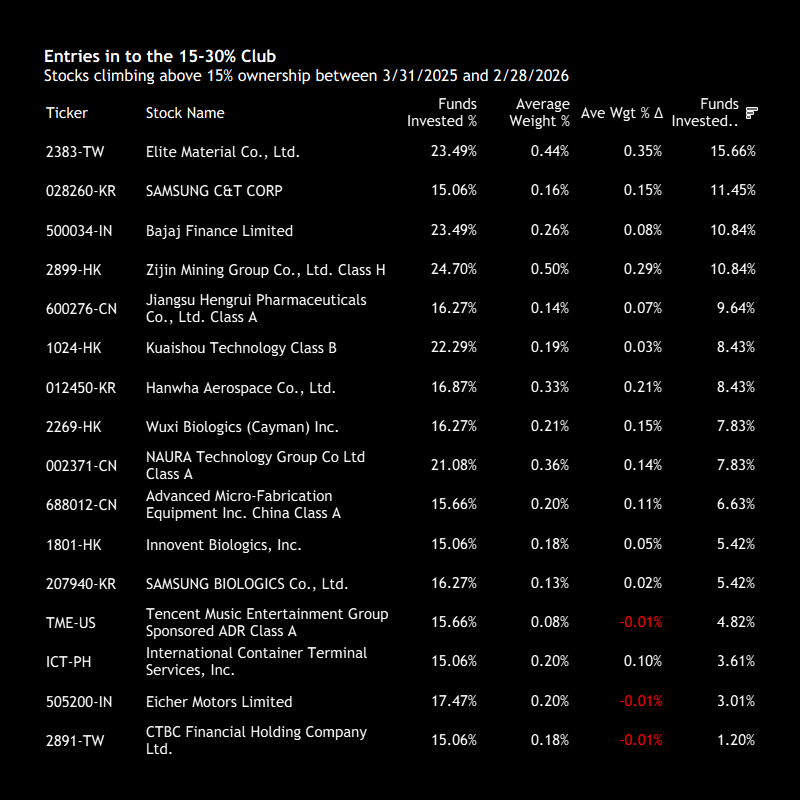
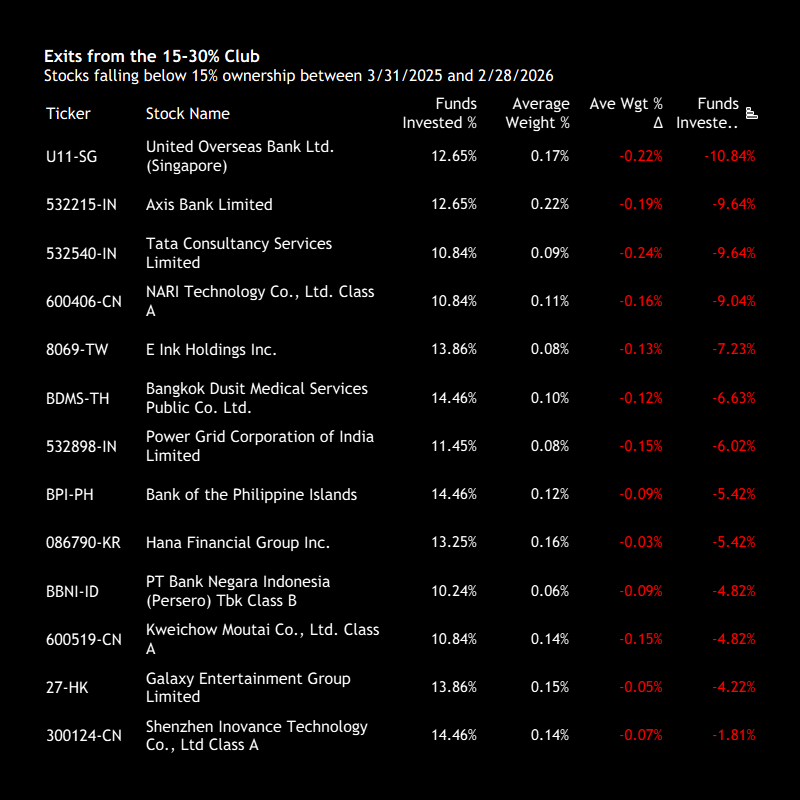
Intra-Cohort Rotation The 15–30% cohort is a curiously small but churny part of the market. Over the past year, 16 companies have entered the bucket, while 13 have exited, against a total of just 52 names.
Entries have come from a mix of sectors, with names such as Zijin Mining, Bajaj Finance and Kuaishou moving up through the 15% threshold. At the same time, a similar number of stocks have fallen out of the range, including United Overseas Bank, Axis Bank and Tata Consultancy Services, reflecting declines in both participation and positioning.
The 0% - 15% Cohort
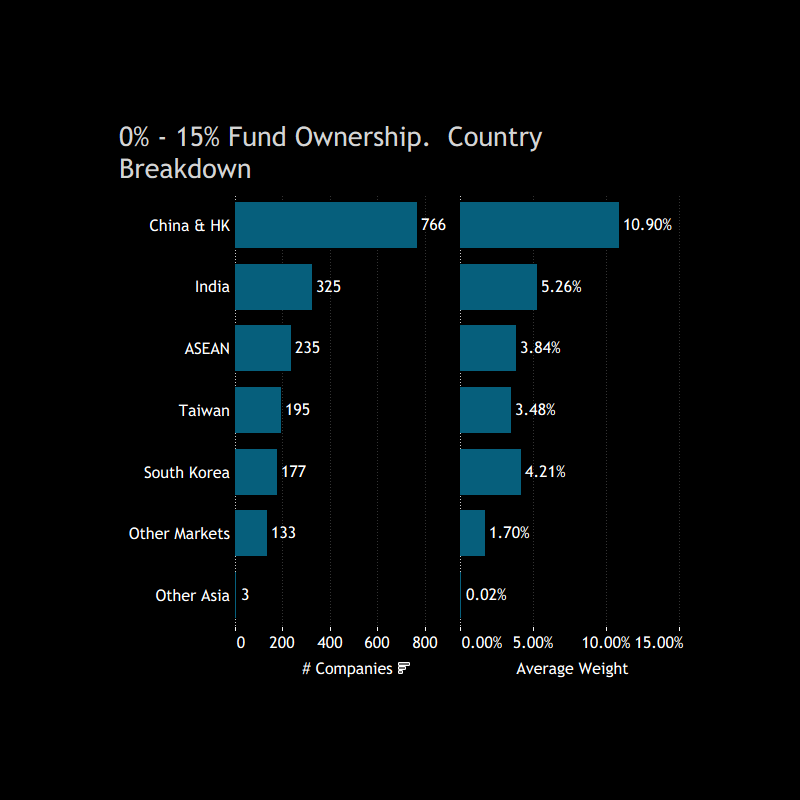
The Long Tail This bucket is where breadth sits, but it’s far from evenly distributed. At the country level, China & HK dominate in both count and weight, with India a clear second. The rest of the region — ASEAN, Taiwan and Korea — forms a secondary layer with smaller but still meaningful contributions.
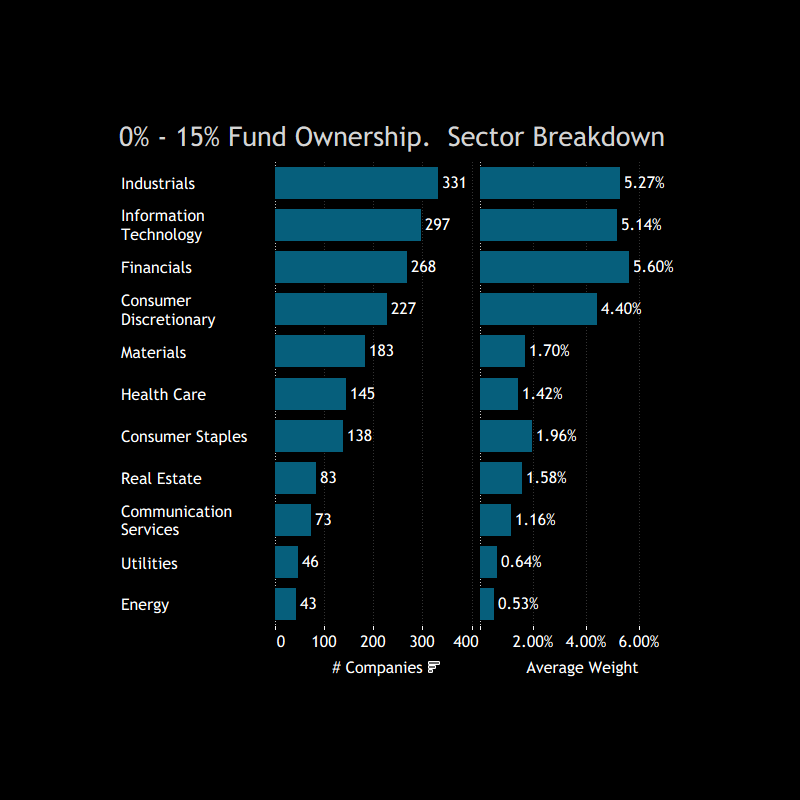
Sector-wise, there is a clear skew toward Industrials, Financials and Information Technology, which together account for the largest share of both companies and weight. Consumer Discretionary also stands out as a meaningful contributor, while other sectors fall away more quickly.
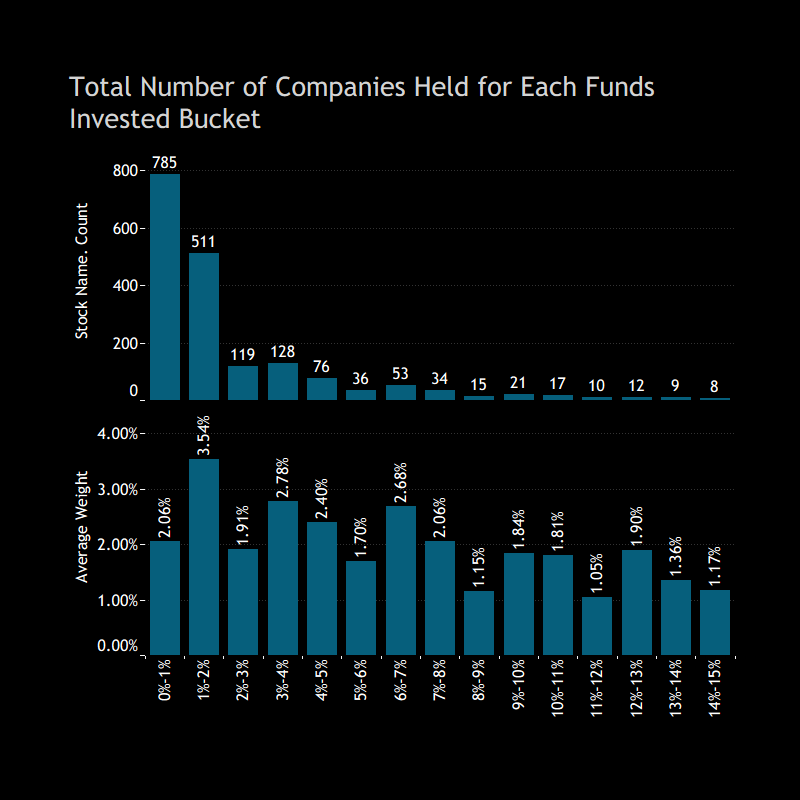
Positioning Breakdown Drilling down within the 0–15% bucket, the distribution is heavily skewed toward the very bottom end. The bulk of names are held by less than 1% of funds, with a sharp drop-off as ownership increases beyond that. These are typically small, tail positions — low weight, low participation, and often used for more tactical or idiosyncratic exposures rather than core holdings.
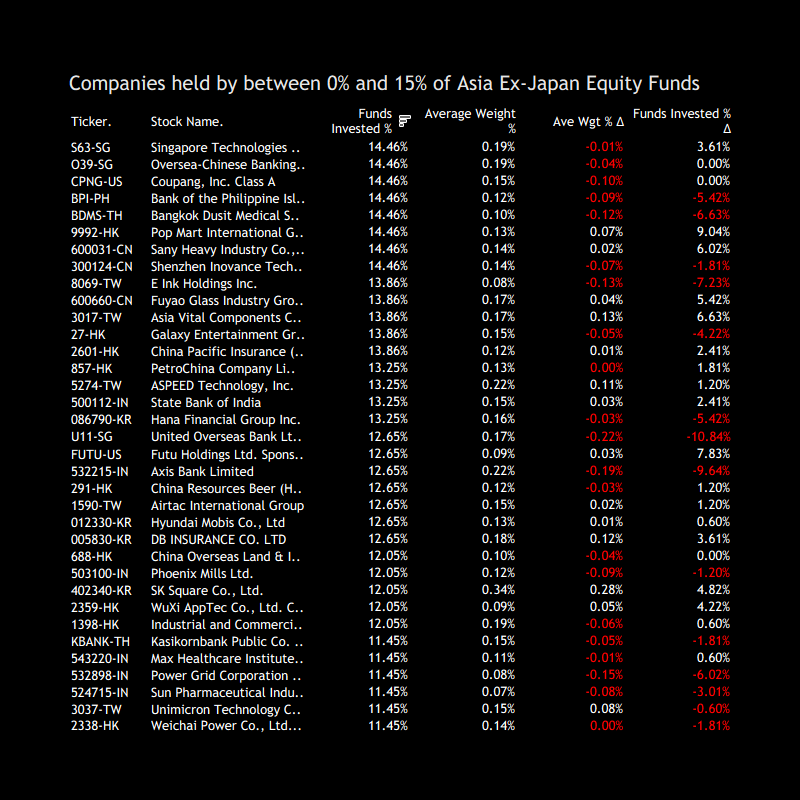
Within this cohort, a mix of financials and domestic names features prominently. Some of the more widely held stocks (still within this low-ownership range) include Singapore Technologies Engineering, Oversea-Chinese Banking Corp, Coupang, Bank of the Philippine Islands and Bangkok Dusit Medical Services.
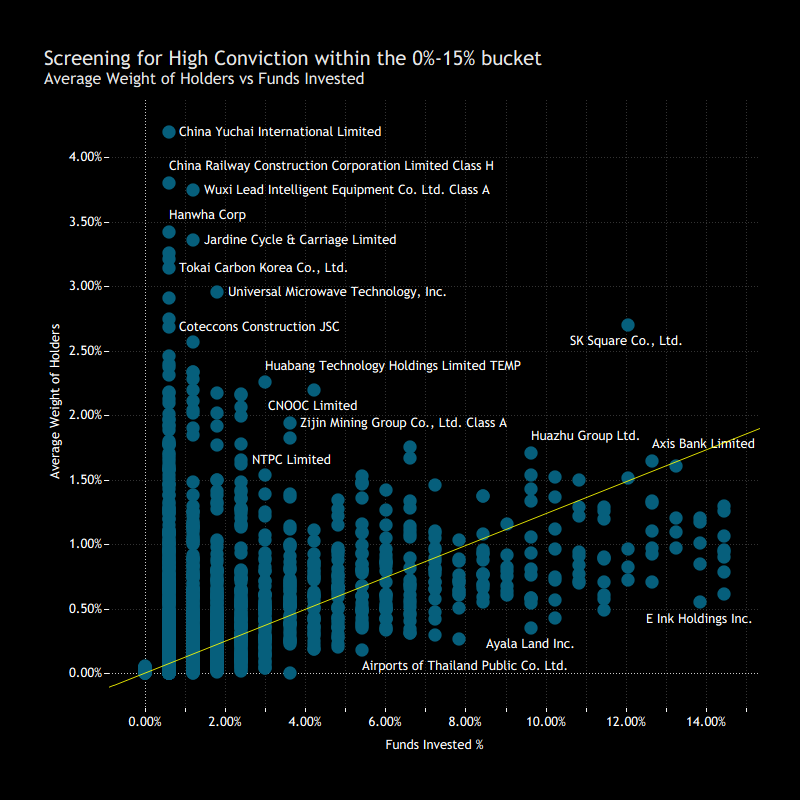
Early-Stage Conviction: Candidates for Broader Adoption Comparing fund ownership against position size highlights a small subset of names held with higher conviction despite still limited participation. While most stocks in this bucket sit with low fund weights, a handful stand out with elevated allocations relative to their ownership levels. Names such as China Yuchai, China Railway Construction and Wuxi Lead Intelligent Equipment show higher average weights despite being held by only a small share of funds.
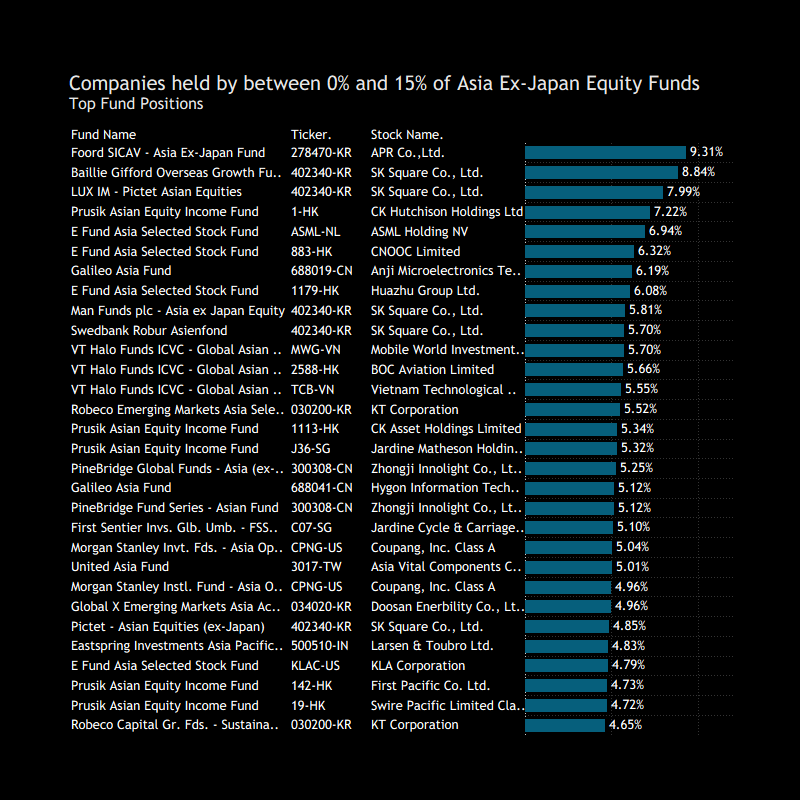
There are also examples further along the adoption curve. SK Square and Huazhu Group combine higher ownership (within the bucket) with still meaningful position sizes, suggesting more established conviction. This is echoed in the largest individual fund positions, where names like SK Square, CK Hutchison, ASM International and CNOOC appear prominently — stocks that are not widely held, but where holders are willing to allocate capital in size.
Conclusion
Asia ex-Japan portfolios show a clear barbell structure: broad dispersion in stock selection, but an increasing concentration of capital in a small group of widely owned names.
While the long tail remains large and active, it continues to lose relative importance as flows concentrate into consensus leaders. The middle of the market is increasingly transitional, with names moving through rather than anchoring portfolios.
Overall, positioning reflects a shift toward higher conviction and shared exposures, even as managers retain flexibility through a diverse set of smaller positions.


