Active UK Funds: Performance & Attribution H1 2026
July 24th 2026
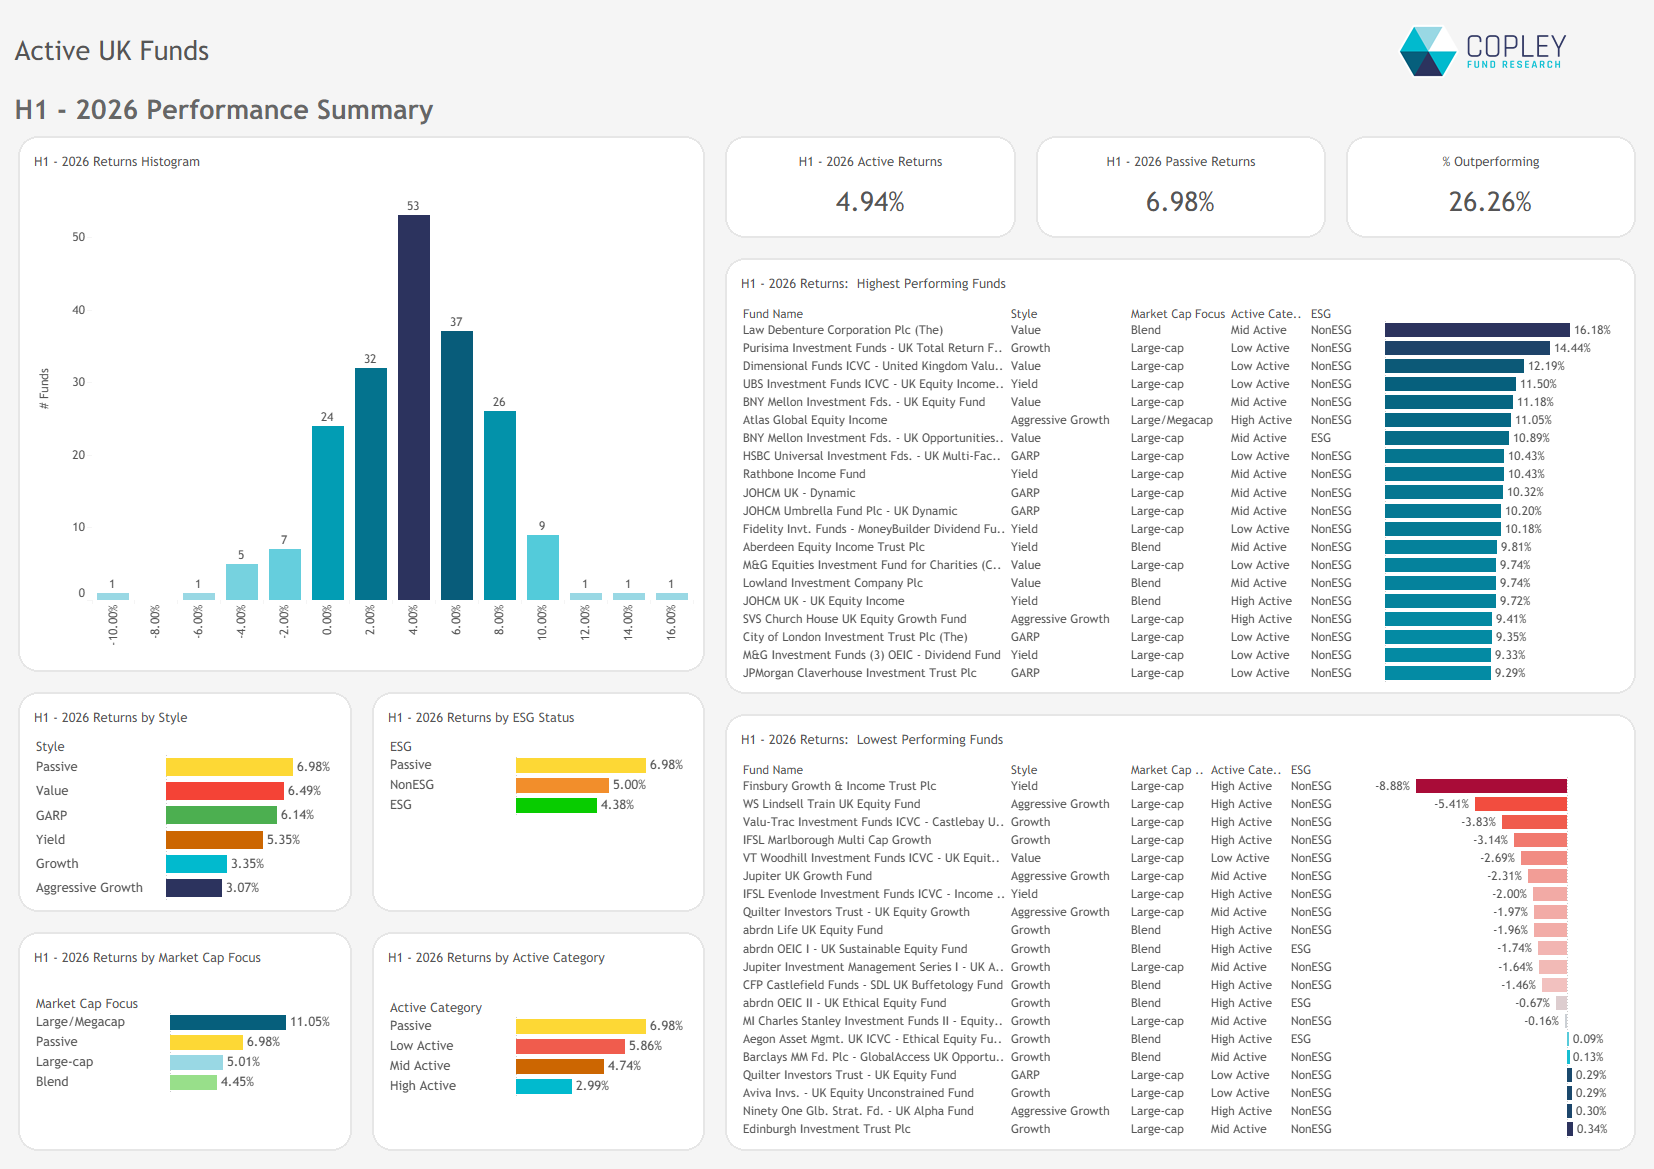
UK active funds delivered strong absolute returns, but the FTSE All Share remained a difficult benchmark to beat, with just 26.3% of funds outperforming in H1 2026.
Financials once again dominated market returns, while underweights in several of the UK’s biggest winners—including HSBC and Rolls-Royce—proved the largest drag on active performance.
Six years of benchmark underperformance raises an important question: should active managers be judged against an increasingly concentrated index, or by the risks they consciously choose not to own?
Strong returns, but a benchmark still hard to beat
Average active UK funds delivered returns of just under 5% over the first half of 2026. Despite a challenging March, were funds lost an average -7.6%, each of the other five months finished in positive territory, helping to maintain the UK’s upward momentum. Even so, the SPDR FTSE All Share ETF finished around 2% ahead, leaving just 26.26% of funds outperforming the benchmark.
No investment style has managed to outperform the index so far this year. Value and GARP funds have come closest, while High Active Share strategies, along with every other fund universe, continue to trail portfolios that remain more closely aligned to the benchmark.
The strongest funds, however, have been well clear of the pack. Law Debenture Corporation, Purisma UK Total Return and Dimensional UK Value lead a group of 12 funds to have delivered double-digit returns in the first half of 2026.
Breaking down H1 returns: Financials drive performance
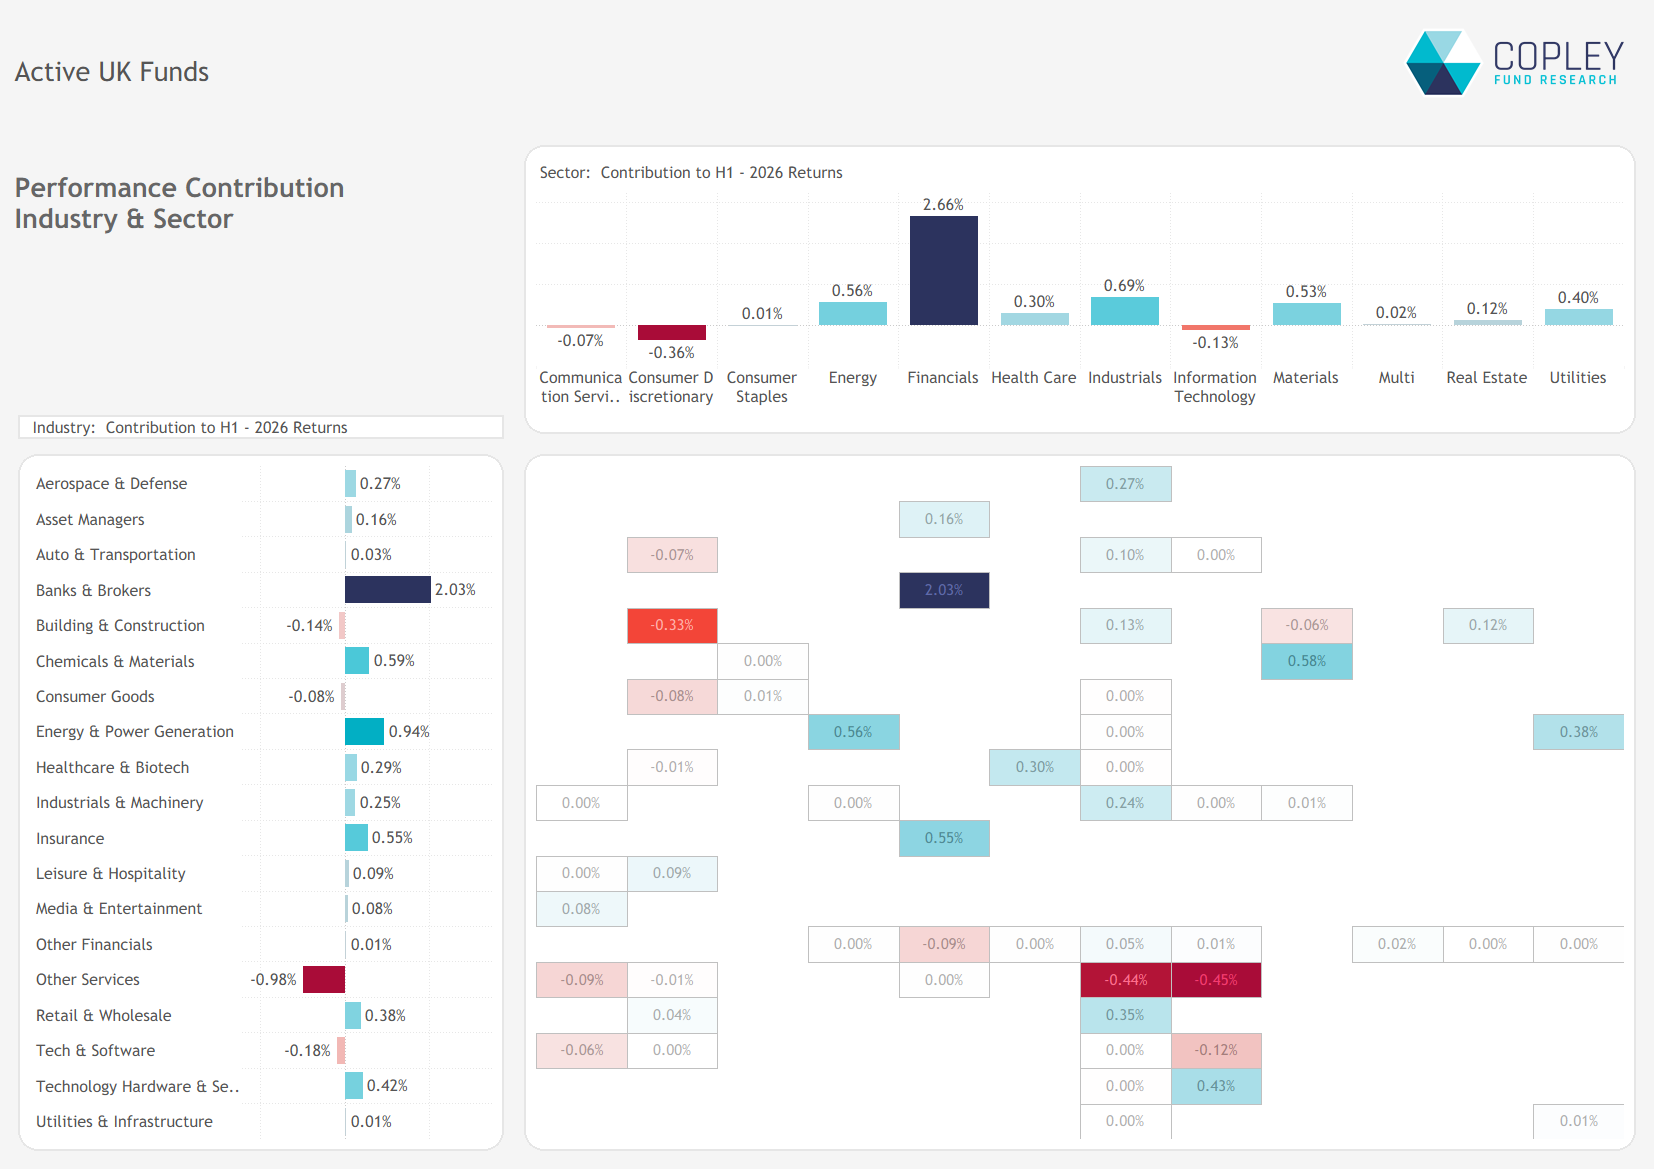
Continuing the trend from 2025, Financials have been the dominant driver of UK equity returns in the first half of 2026, accounting for more than half of the asset class’s total return. Banks and Brokers have been responsible for the bulk of those gains, while Energy, Industrials and Materials have provided additional support.
Elsewhere, Technology and Consumer Discretionary holdings have weighed on performance. The largest drag, however, came from the ominously titled ‘Other Sectors’, where losses across a collection of Industrials and Technology companies shaved just under 1% from overall returns.
Stock-Level Influence
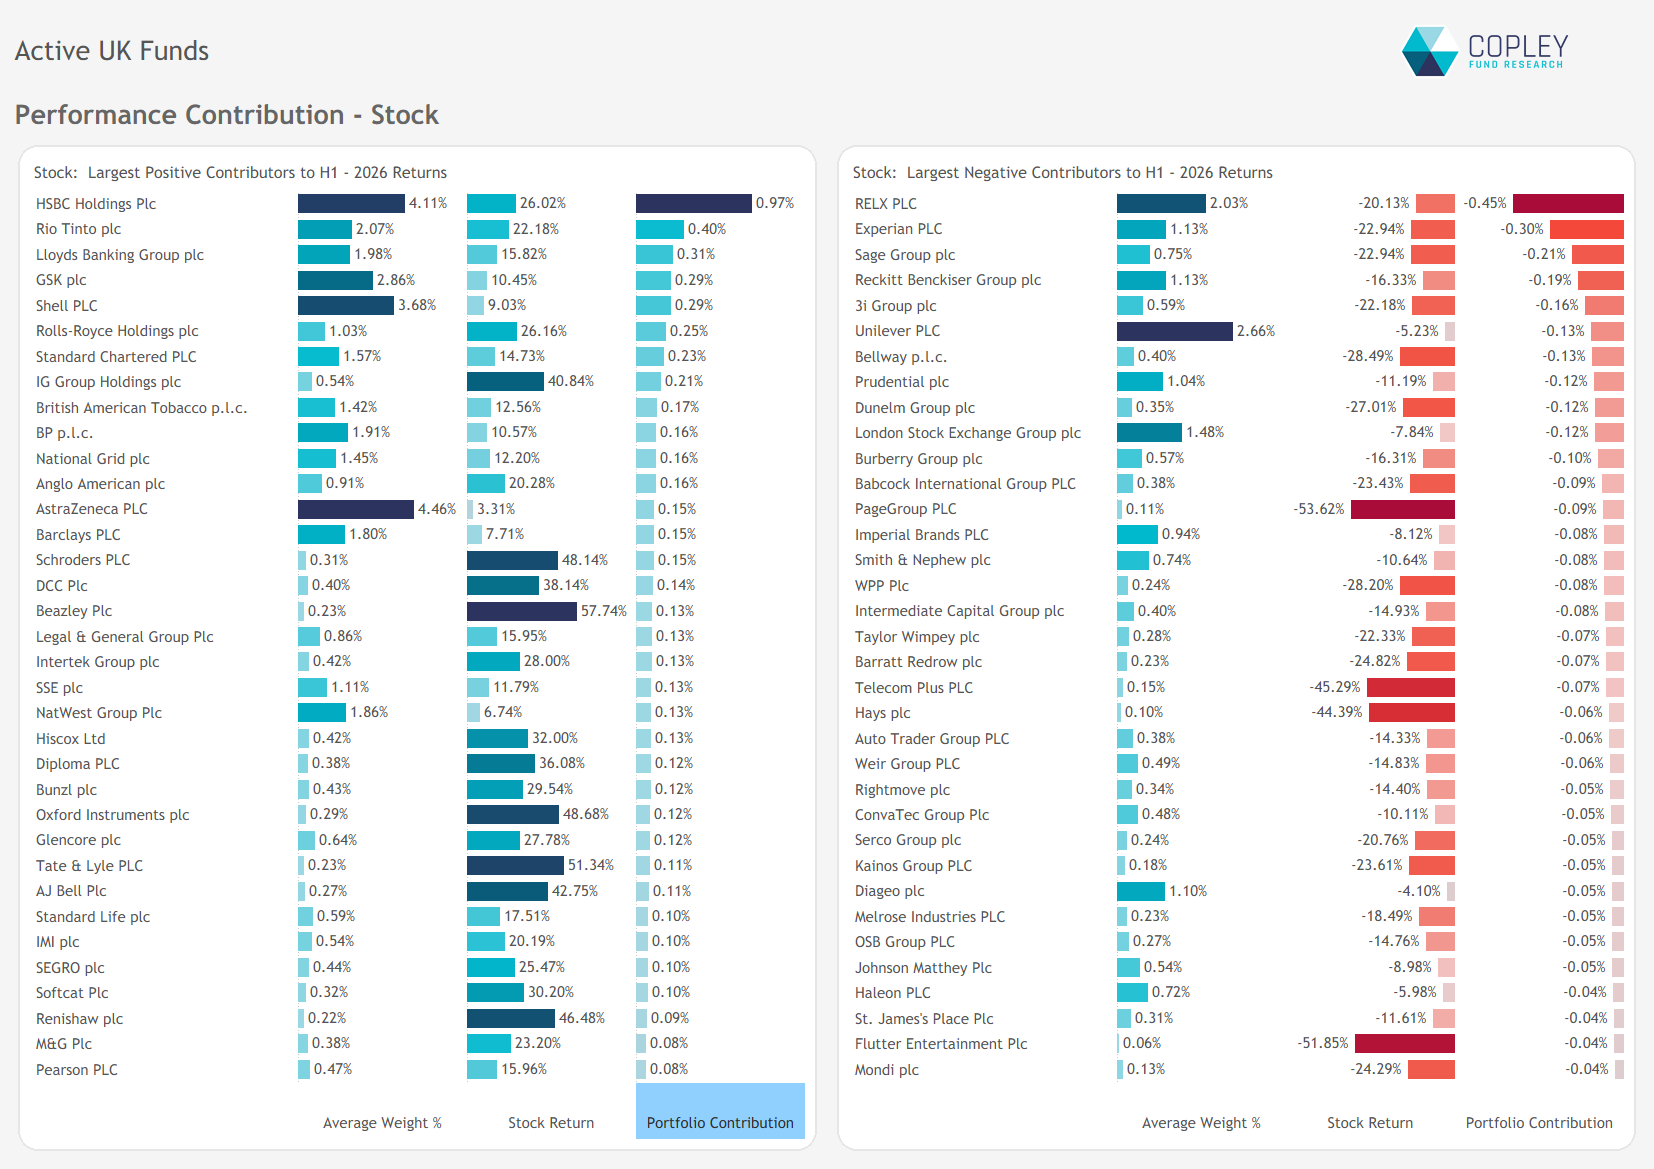
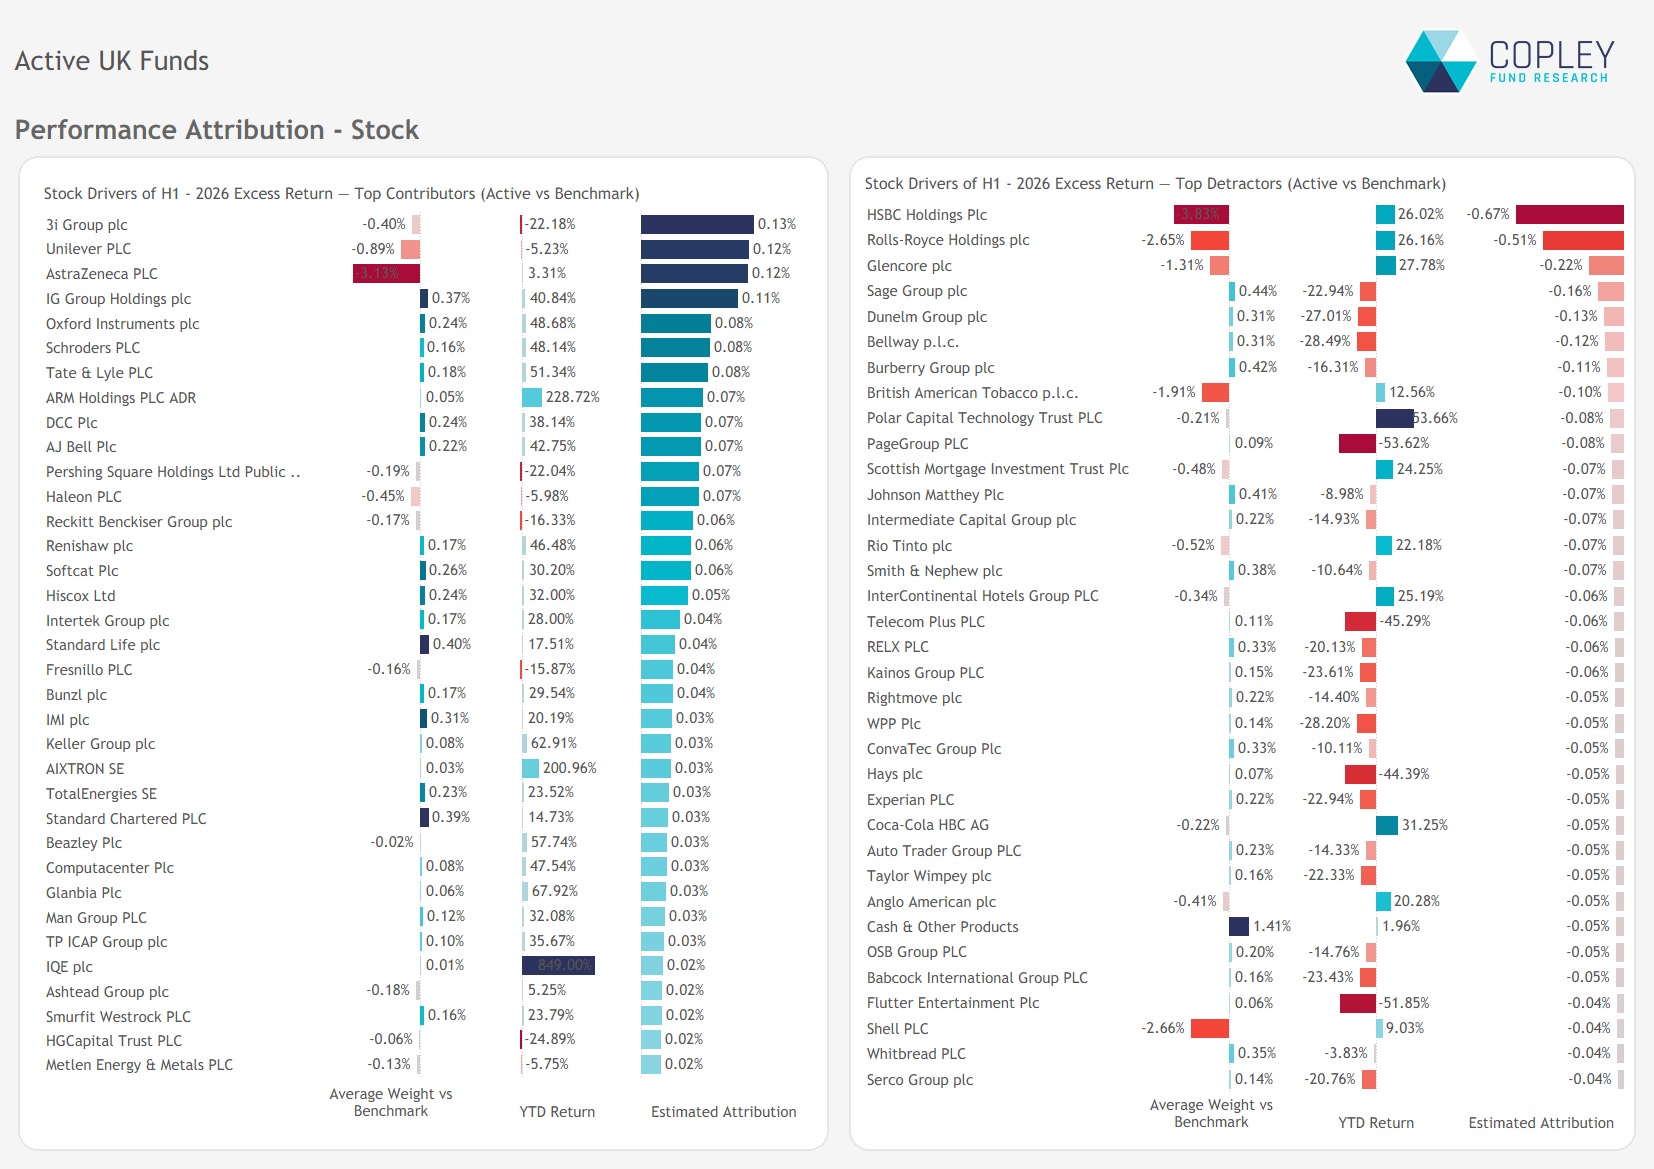
The chart below highlights the largest stock-level contributors and detractors for active UK managers in H1 2026. Several of the asset class’s biggest holdings have also significantly outperformed the broader UK market, with HSBC, Lloyds Banking Group, Rio Tinto, GSK and Shell PLC all returning between 10% – 20%, compared with around 5% for the average UK fund.
On the negative side, RELX, Experian and Sage Group proved the largest detractors, reducing aggregate portfolio returns by a combined 0.96%.
Performance Attribution – Where Did Active Managers Win and Lose?
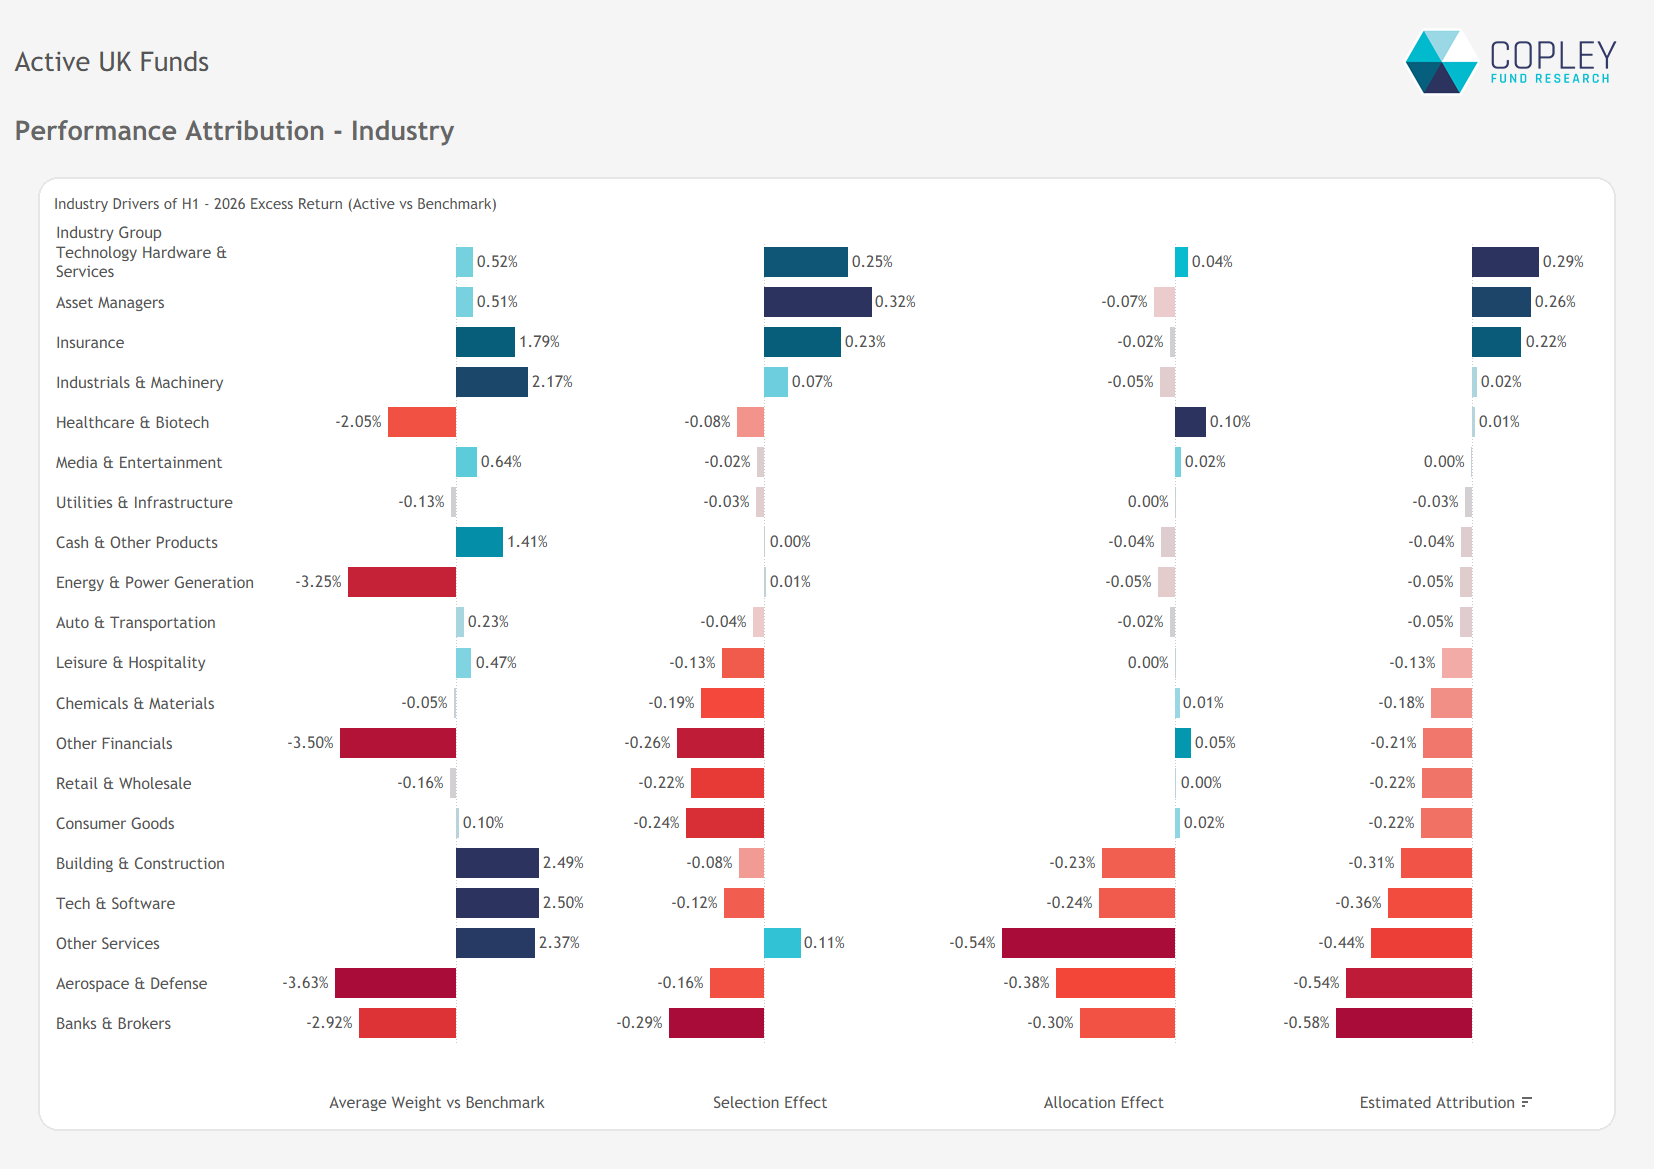
Given the broad underperformance of active UK funds, it is no surprise that industry-level detractors comfortably outweighed contributors. The main areas of outperformance came through stock selection, particularly in Technology Hardware & Services, Asset Managers and Insurance.
The larger losses, however, came from allocation decisions. Overweights in Technology & Software, Other Services, and Building & Construction, together with underweights in Aerospace & Defence and Banks & Brokers, proved particularly costly. Stock selection also detracted in Consumer Goods, Other Financials, and Retail & Wholesale.
Stock Attribution: Underweights Cause More Pain
The biggest attribution losses once again came from some of the market’s strongest performers. Active UK managers remain materially underweight several of the FTSE All Share’s largest constituents, including HSBC (3.8%), Rolls-Royce (2.6%), British American Tobacco (1.9%) and Glencore (1.3%). All four have delivered returns well ahead of the broader market so far this year.
Underweights in 3i Group, Unilever and AstraZeneca provided some relief, while a number of smaller active overweights also added value at the margin. Collectively, however, they were not enough to offset the cost of missing some of the year’s strongest performers.
Long-Term Performance
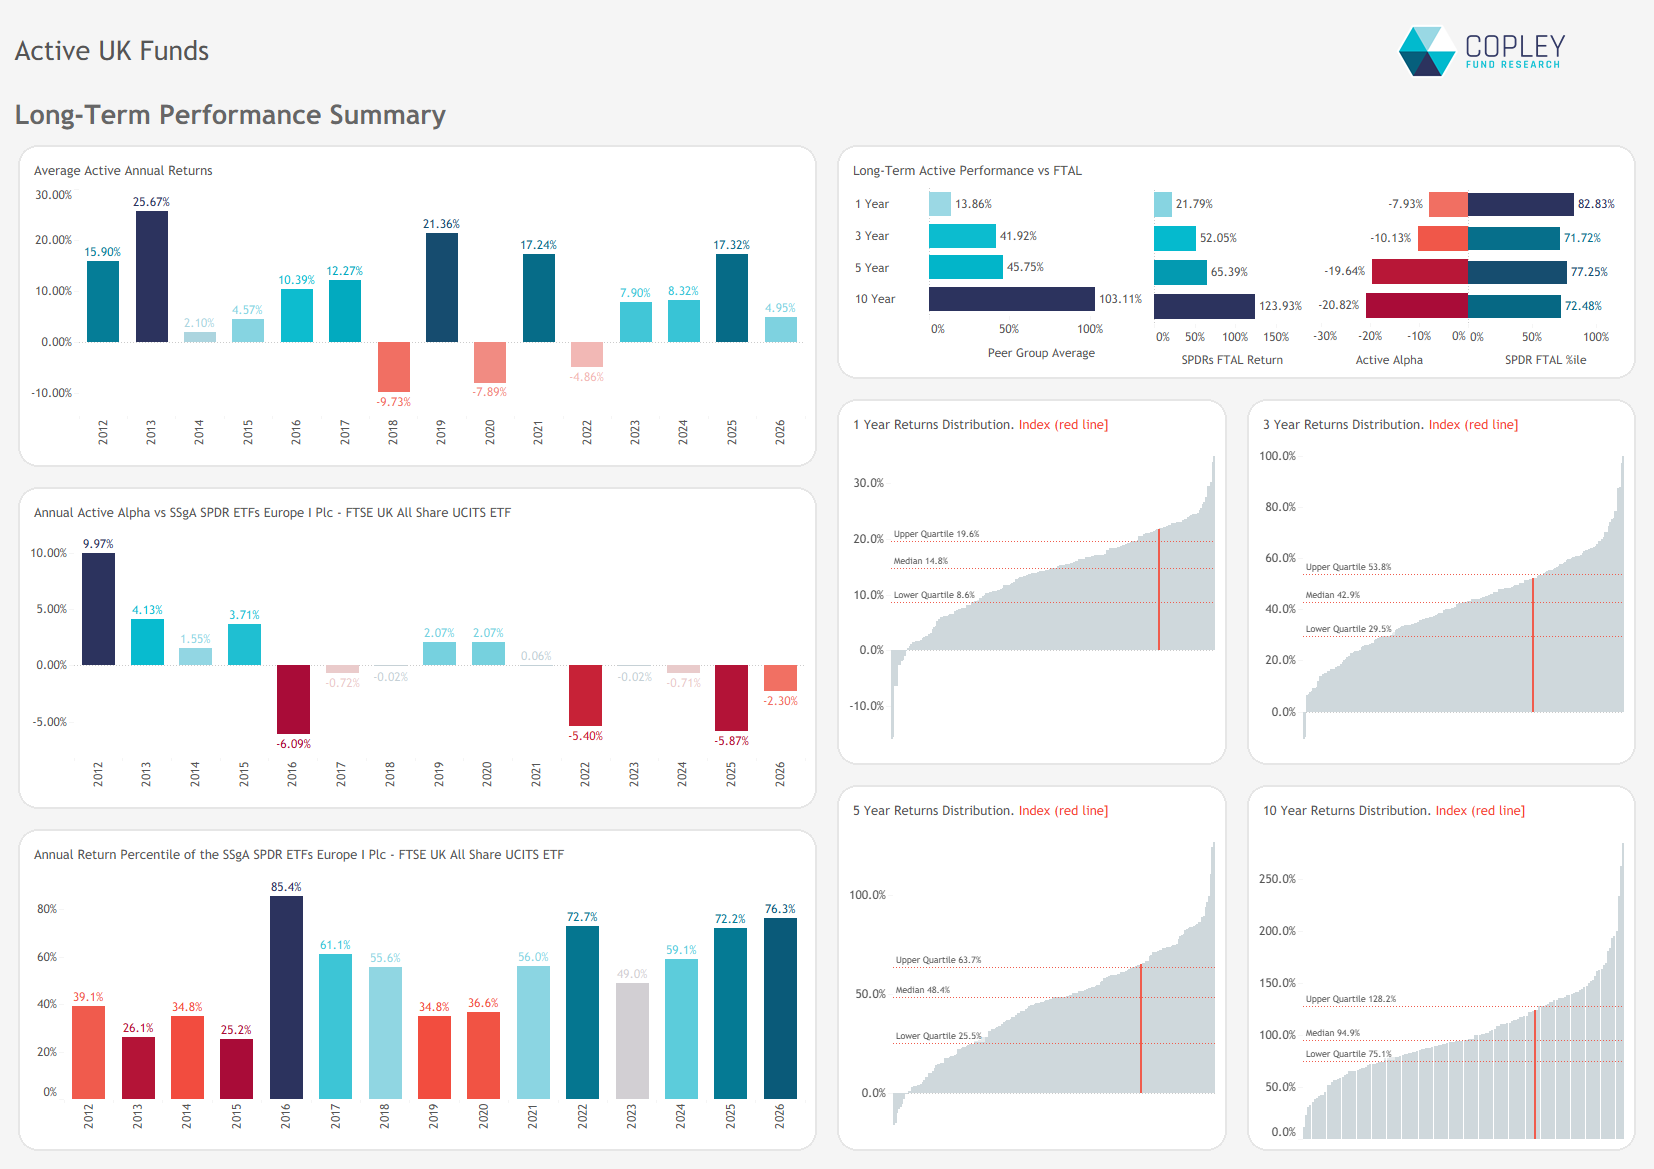
The charts below track the long-term performance of the average active UK fund against the SPDR FTSE All Share ETF. This year’s results extend a six-year period of flat or negative relative performance, leaving active funds trailing the benchmark by 20.8% over the past decade. The SPDR FTSE All Share ETF has now ranked in the top quartile of active peers in three of the past five calendar years.
The numbers paint a difficult picture for active management, but they also raise a broader question. As the benchmark becomes increasingly concentrated in a handful of very large companies—many with earnings driven well beyond the UK—is matching the index necessarily the right objective? Or should allocators instead be asking whether those concentrations represent risks that active managers are deliberately choosing not to replicate?
Performance & Attribution Report
Click the link opposite for full charts and data detailing the drivers of H1 2026 performance, along with a review of 3-, 5-, and 10-year results across the active UK peer group.