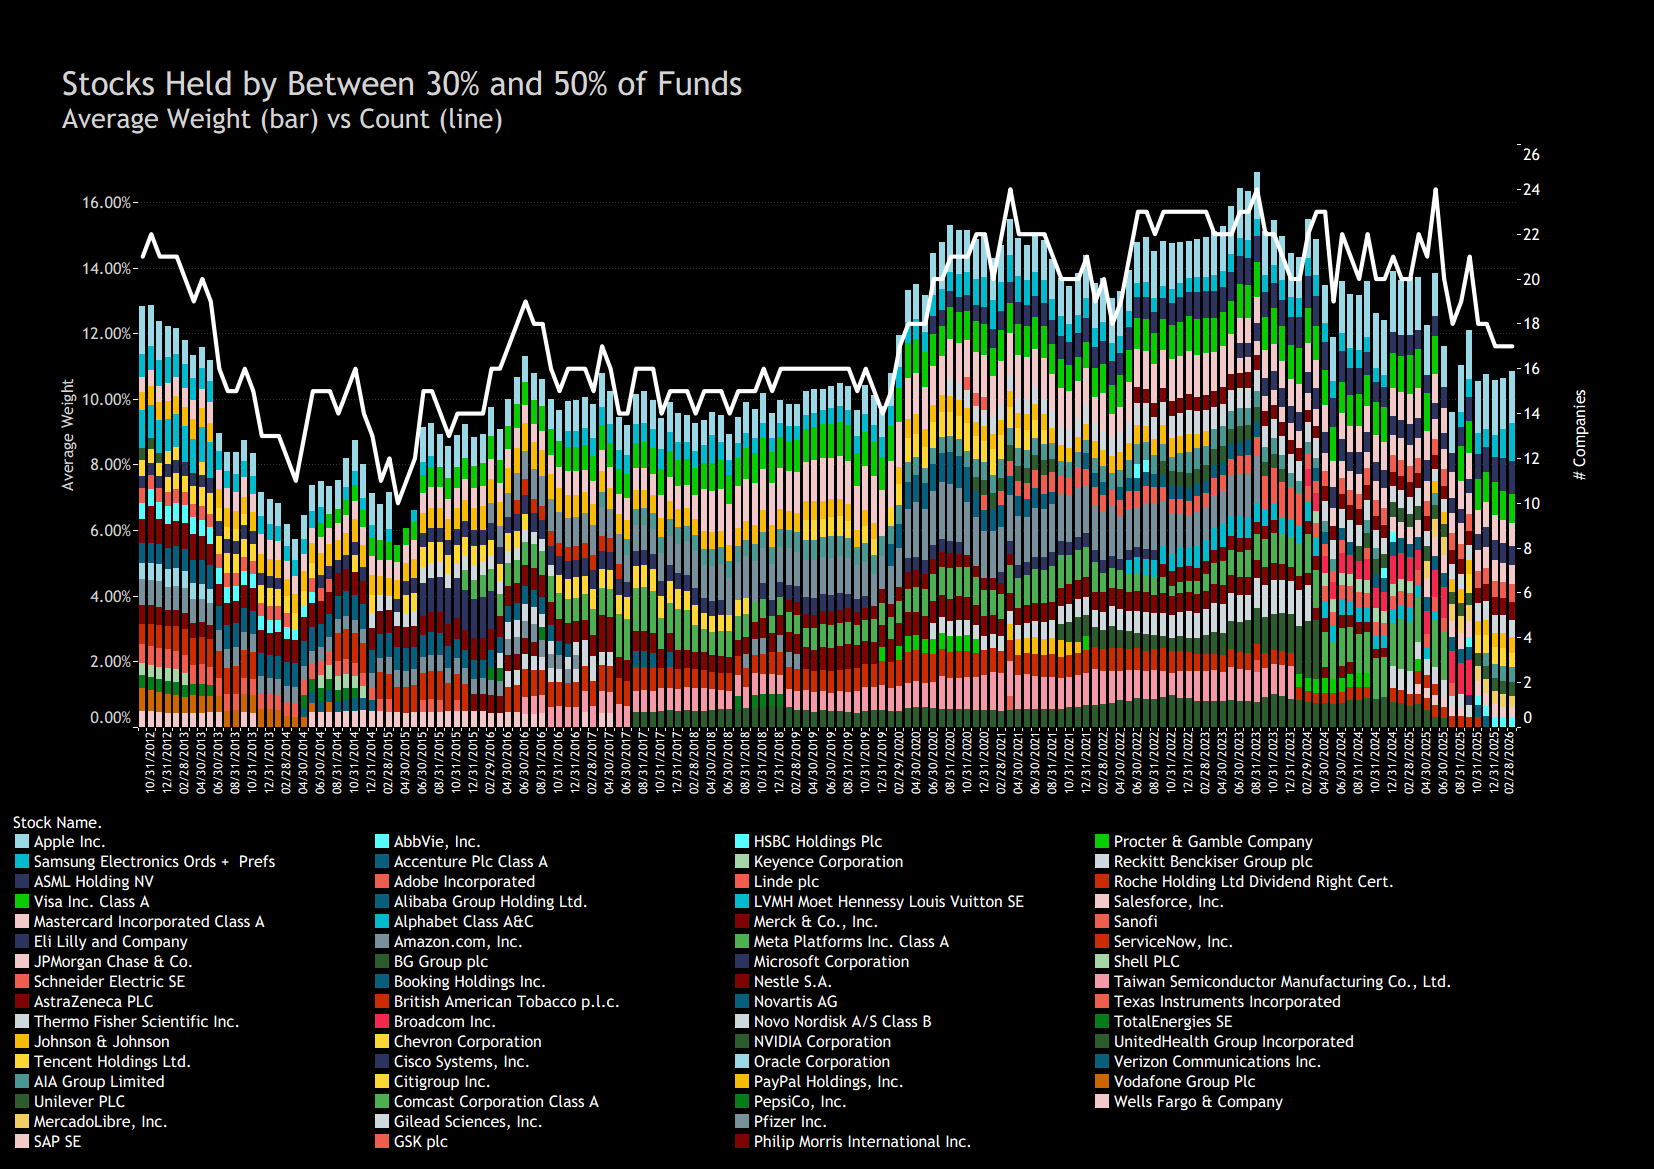
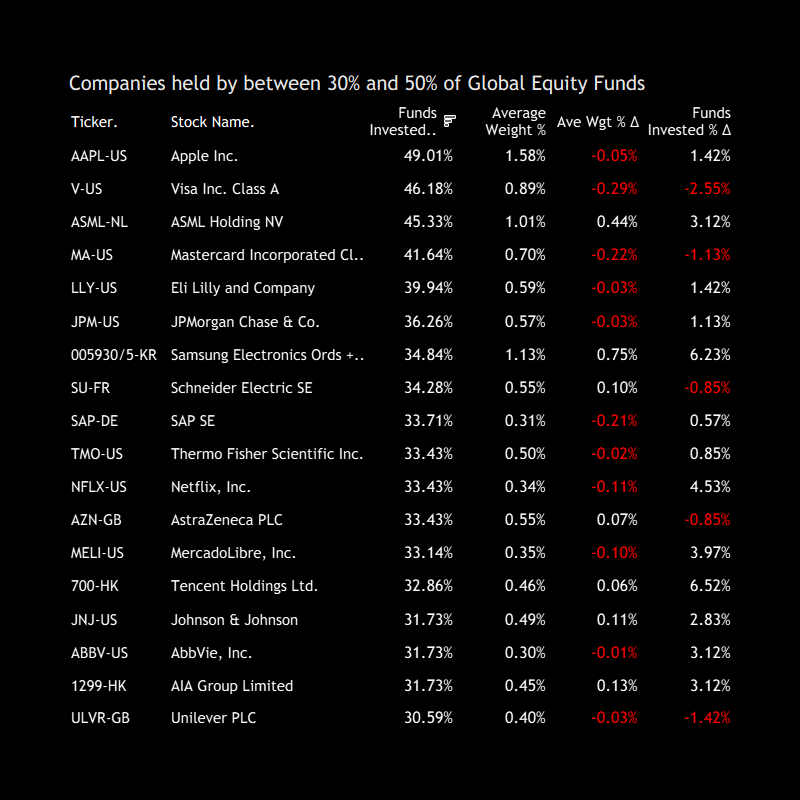
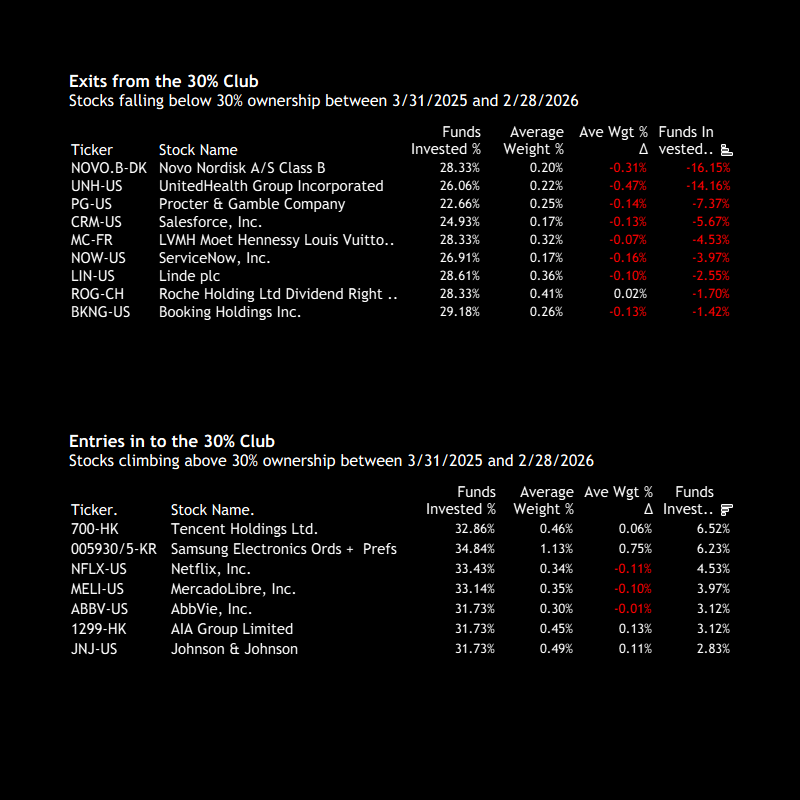
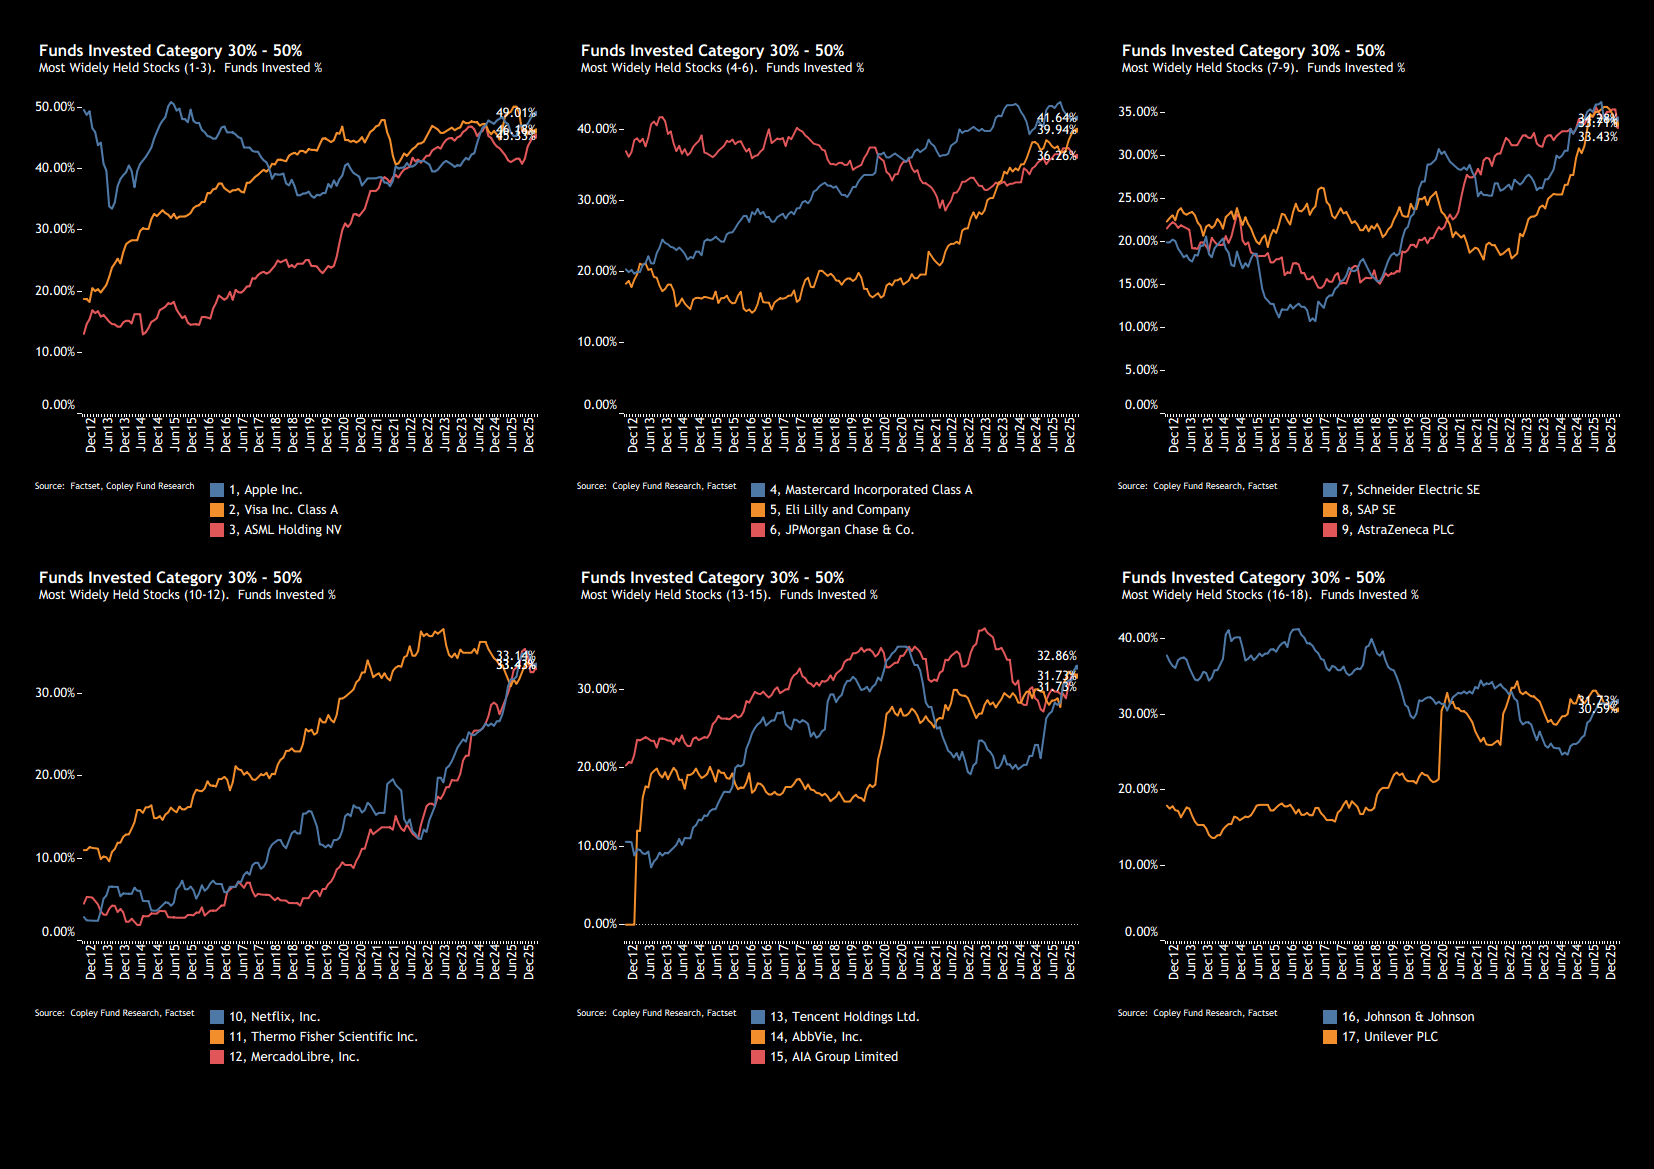
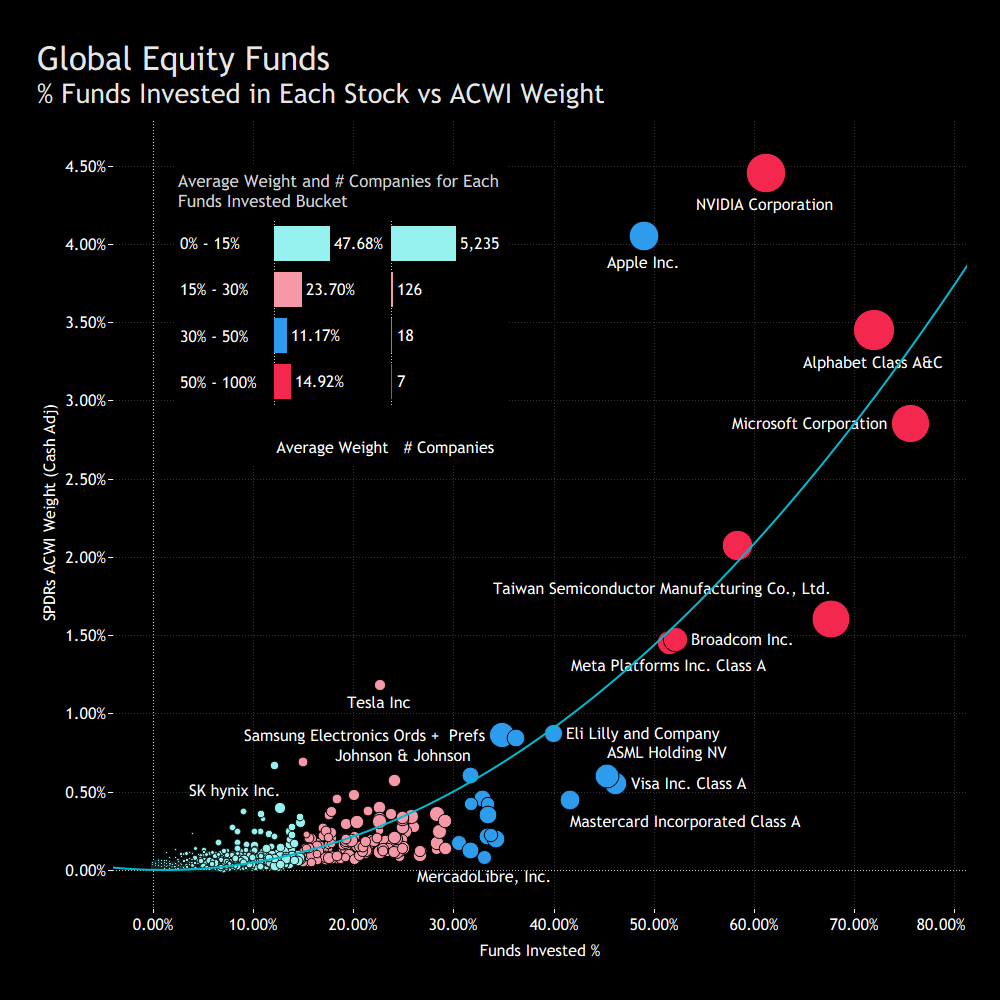
Global Stock Radar: Ownership, Concentration and Conviction in Global Equities

Global Equity

March 30th 2026

Executive Summary

This analysis examines how active Global equity managers allocate capital across companies, focusing on ownership breadth, concentration, and conviction.  While portfolios have become more concentrated— with a small group of stocks accounting for an increasing share of capital—this masks a more important dynamic. Nearly half of total fund weight (~47%) remains invested in stocks held by fewer than 15% of managers.

In other words, while top holdings are increasingly aligned, true differentiation sits deeper within portfolios. It is within this long tail—through stock selection and position sizing—that managers express conviction, take risk, and diverge from peers.

Understanding Global equity portfolios therefore requires looking beyond the consensus core to where strategies are truly defined.

How Many Companies Do Active Global Investors Own?
The number of companies held by active Global funds peaked at more than 6,800 in 2017, before entering a steady and persistent decline. Over the past two years, this contraction has stabilised, with the total consolidating in a narrower 5,200–5,400 range. Today, active Global managers collectively hold 5,336 companies across the 353 funds in our analysis.

Regionally, North America continues to dominate, accounting for 1,855 companies. This is followed by Developed Europe (1,090), Asia’s Big Four (954) and Developed Asia (864). Combined, these regions represent nearly 90% of all companies, with only limited representation from smaller Emerging Market countries and regions.

Ownership Breadth
Ownership breadth across Global portfolios is highly skewed. The vast majority of stocks are held by only a small fraction of funds, with 4,589 companies owned by fewer than 5% of investors. From there, the opportunity set narrows rapidly as ownership broadens, highlighting that only a limited subset of companies achieves widespread adoption.

However, this skew in stock count does not fully translate into portfolio concentration. Companies held by fewer than 15% of managers account for 97.2% of all names, but still represent a meaningful 47.4% of the average fund’s weight. In other words, nearly half of aggregate Global fund exposure sits in stocks that are not widely owned—highlighting how managers continue to differentiate at the margin.

This sits alongside a more concentrated top end. Just seven companies are owned by more than 50% of funds, yet they account for 14.9% of the average Global portfolio. These positions reflect high-conviction, widely shared exposures, creating a structure where portfolios are differentiated in the long tail, but anchored by a small group of consensus leaders.

Concentration on the Rise
Global portfolios have become more concentrated in high-conviction names over time. A decade ago, close to 60–65% of the average fund was allocated to companies owned by fewer than 15% of managers; today, that has fallen to 47.4%, reflecting a steady move away from the long tail.  This shift has been driven primarily by increased allocation to the most widely held names. Companies owned by more than 50% of managers now account for 14.9% of the average fund, marking a clear rise in consensus, high-conviction positioning.

Meanwhile, the middle ownership buckets (15–50%) have remained relatively stable, reinforcing that the key change has been a rotation out of less-owned stocks and into the most crowded part of the market.  The result is a more concentrated portfolio structure: differentiation persists, but an increasing share of performance is tied to a small group of widely held leaders.

Stocks held by more than 50% of funds

The number of stocks held by more than 50% of Global funds has increased in recent years, rising to seven today. This stands out in a historical context—since 2012, only 11 companies have ever reached this level of ownership, with a majority of them represented in the current cohort.

At the same time, the weight allocated to these names has also increased. What was once a relatively small share of portfolios now accounts for nearly 15% of the average Global fund.

Ownership Trends within the 50% Club
The composition of the most widely held stocks has evolved over time, with a clear shift toward a small group of large-cap technology and platform companies. Microsoft Corporation remains the most widely held name, with ownership rising to over 75% of Global funds. Alongside this, NVIDIA, Amazon.com, Meta Platforms, and Alphabet Inc. have all seen strong increases in fund participation, particularly in recent years.

More recently, Taiwan Semiconductor Manufacturing Company and Broadcom Inc. have also moved into this cohort, with ownership levels rising and now exceeding 50% of funds.

This increase in ownership has been matched by higher portfolio weights. Alphabet Inc. is now the largest position at just over 3%, followed by NVIDIA Corporation, while Microsoft Corporation has moved lower from previous peaks. Taiwan Semiconductor Manufacturing Company is now approaching similar weight levels, while Meta Platform and Amazon.com have seen exposure levels decline.

The 30% - 50% Cohort

The 30%–50% ownership bucket has remained relatively contained over time. Since 2012, only 62 companies have ever fallen into this range, with the number typically sitting between 16 and 24 at any one point. That makes this a meaningful but still selective part of the Global opportunity set.

In weight terms, this cohort has grown since the middle of the last decade, with average fund exposure rising from high single digits to the mid-teens at its peak. More recently, that total has eased back, though it remains a sizeable part of the average Global portfolio.

The composition of the bucket has also shifted over time. Earlier periods show a broader mix of defensive, consumer, healthcare and industrial names, while more recent years have seen greater representation from large-cap technology and semiconductor stocks. This suggests that the 30%–50% range often acts as a staging ground: a place where important holdings build broad acceptance across portfolios, but do not always remain there permanently.

30–50% Cohort: Snapshot & Turnover Dynamics
Current positioning within the 30%–50% ownership range comprises 17 companies and remains relatively balanced across sectors and regions. The cohort includes a mix of large-cap technology names such as Apple and ASML Holding, alongside financials like JPMorgan and Mastercard , and a range of healthcare, industrial and consumer companies. Individual position sizes remain moderate, generally clustering around 0.3% to 1.5% of average fund weight.

A number of stocks have moved below the 30% threshold over the past year, including Novo Nordisk A/S, UnitedHealth Group Incorporated and LVMH Moët Hennessy Louis Vuitton, with declines driven by both reduced fund participation and lower average weights.

At the same time, new entrants continue to emerge into the cohort. Tencent Holdings Ltd. and AIA Group Limited have seen increases in ownership, while AbbVie Inc. and Johnson & Johnson have moved back into the range. This ongoing entry and exit highlights the role of the 30%–50% bucket as a fluid part of portfolios, where positions can build or fade depending on changes in conviction and relative positioning.

Diverging Paths Within the Middle Cohort
Ownership trends across the current constituents show a range of different patterns. Apple, JPMorgan Chase and AIA Group have all seen periods of rising and falling participation, with ownership moving within established ranges rather than following a sustained upward trend.

Elsewhere, a number of stocks are now at or near peak ownership levels following persistent increases in fund participation. Eli Lilly, Netflix and MercadoLibre have all moved higher over time, reaching the upper end of their historical ownership ranges.  Meanwhile, stocks such as Thermo Fisher and Johnson & Johnson remain well owned, but are still below previous peaks in ownership.

The 15% - 30% Cohort

Broad but Lower Conviction
The 15%–30% ownership bucket represents a much broader part of the Global equity universe. In total, 126 companies currently fall into this range.  Regionally, this group remains heavily skewed toward developed markets. North America accounts for the largest share, with 77 companies representing over 14% of average fund weight. Developed Europe also features prominently, while exposure to Asia and Emerging Markets is more limited, both in terms of number of companies and portfolio weight.

At the stock level, the cohort includes a mix of well-established large-cap names that are widely held but not core positions across portfolios. This includes companies such as Cisco Systems and Qualcomm Incorporated within technology, alongside consumer and healthcare names such as Procter & Gamble and Novartis AG.

The bucket also includes a number of globally diversified industrial and luxury names, including Siemens AG and LVMH Moët Hennessy Louis Vuitton, reflecting its role as a broad, cross-sector segment of portfolios.

Intra-Cohort Rotation
Turnover around the 15% ownership threshold remains active, with a steady flow of names both entering and exiting the 15%–30% bucket. On the exit side, several stocks have moved below the threshold, including Fiserv, Inc., London Stock Exchange Group and Wolters Kluwer N.V.

At the same time, a number of companies have crossed above the 15% level. Siemens Energy AG, Micron Technology and Banco Bilbao Vizcaya Argentaria, S.A. have all seen ownership levels increase to above the lower threashold.

Screening for High Conviction Names in the 15% – 30% Cohort
Comparing fund ownership against average position size highlights which stocks are held with greater conviction by their owners. While most names cluster around ~0.6%–1.0% weights, a subset stands out with higher allocations relative to their ownership levels.

For example, compare Oracle Corporation versus Applied Materials, Inc.: both are held by just over 20% of funds, yet the average position size for Oracle is ~1.5% compared to ~0.6% for Applied Materials, highlighting a clear difference in conviction.  L’Oréal S.A. and Lam Research Corporation are two further examples of higher-conviction names, and both feature among the larger individual fund positions shown in the right-hand chart.

The 0% - 15% Cohort

The Long Tail
The <15% ownership bucket represents the vast majority of the Global equity universe, with thousands of companies held by only a small fraction of funds. In aggregate, this still accounts for a substantial ~47% of total Global fund weight.

However, this exposure is spread thinly across a wide range of names, with individual position sizes remaining small. The bucket includes a diverse mix of companies such as Philip Morris International Inc., McDonald’s Corporation and BlackRock, Inc.—well-known businesses, but held with lower conviction and less consistency across portfolios.

Rotation within the group
Turnover within the <15% ownership bucket remains active, with a steady flow of names moving both higher and lower in fund participation. On the upside, stocks such as Banco Santander, S.A., Ryanair Holdings plc and Contemporary Amperex Technology Co., Limited have seen recent increases in ownership.

At the same time, other names have moved lower, including adidas AG, BYD Company Limited and Sika AG, where fund participation has declined after earlier periods of stronger ownership.

Early-Stage Conviction: Candidates for Broader Adoption
Comparing fund ownership against average position size highlights a small group of stocks held with higher conviction despite low overall participation. While most names in this bucket have relatively small weights, a subset stands out with meaningfully larger allocations by their holders.

Examples include SK hynix Inc., ASSA ABLOY AB and Safran S.A., which combine lower ownership with above-average position sizes.  This is reinforced by the largest individual fund positions, where names such as Medpace Holdings, Inc. and KeySight Technologies, Inc. feature prominently, highlighting stocks that, while not widely held, are owned in size by a smaller group of managers.

Conclusion

Global equity portfolios are increasingly shaped by a shared set of high-conviction positions at the top, with a small group of widely held companies accounting for a growing share of capital. This creates a more aligned core across managers, where differences in positioning are relatively limited.  However, this is only part of the picture.

Nearly half of total portfolio weight remains distributed across a vast number of less widely owned stocks. It is within this long tail that managers express their highest levels of differentiation—through stock selection, position sizing, and willingness to deviate from consensus.  The middle ownership cohorts act as a transition zone, where stocks move between broader acceptance and more differentiated positioning. But the defining characteristics of a portfolio are rarely found in the most widely held names.

For fund managers and allocators alike, the key takeaway is that analysing top holdings is no longer sufficient. As portfolios become more aligned at the core, understanding the structure, composition and conviction within the long tail is essential to identifying true differentiation, assessing risk, and distinguishing between strategies.

In an environment where consensus is strengthening, it is the tail—not the core—that increasingly defines the fund.